


 Arguments


Warming oceans consistent with rising sea level & global energy imbalance
Posted on 29 January 2014 by dana1981, Rob Painting, Kevin Trenberth
- The ocean is quickly accumulating heat and is doing so at an increased rate at depth during the so-called “hiatus” – a period over the last 16 years during which average global surface temperatures have risen at a slower rate than previous years.
- This continued accumulation of heat is apparent in ocean temperature observations, as well as reanalysis and modeling experiments, and is now supported by up-to-date assessments of Earth's energy imbalance.
- Another key piece of evidence is rising global sea level. The expansion of the oceans (as they warm) has contributed to 35–40% of sea level rise over the last two decades - providing independent corroboration of the increase in ocean temperatures.
The Deep Ocean Layers are Quickly Accumulating Heat
Recently there have been some widespread misconceptions about heat accumulation in the oceans, particularly in the deeper layers below 700 meters. Balmaseda et al. (2013) was a key study on this subject, using ocean heat content data from the European Centre for Medium-Range Weather Forecasts' Ocean Reanalysis System 4 (ORAS4). A ‘reanalysis’ is a climate or weather model simulation of the past that incorporates data from historical observations. In the case of ORAS4, this includes ocean temperature measurements from bathythermographs and the Argo buoys, and other types of data like sea surface height and surface temperatures. Their study concluded that heat has increased in the deep oceans at an unprecedented rate in recent years, with approximately 30 percent being sequestered below 700 meters since the year 2000.
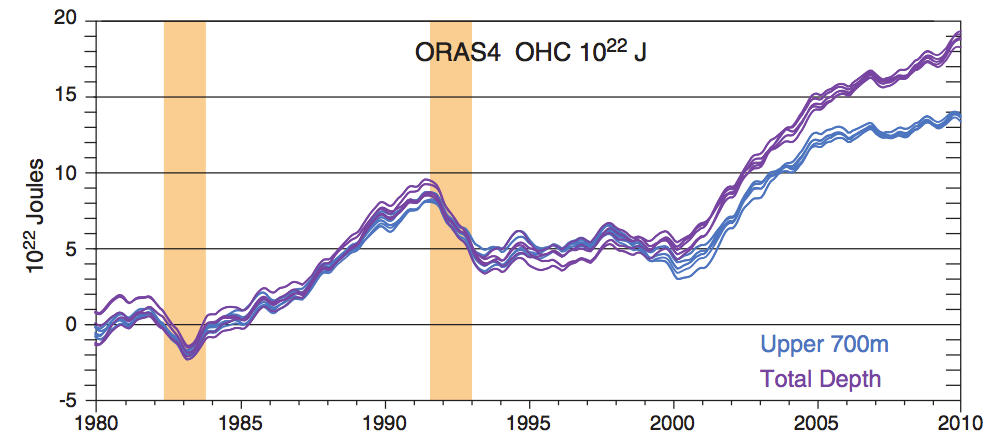
The five ensemble members of the ORAS4 ocean reanalysis OHC for 0–700m and full-depth ocean are shown, where they have been aligned for 1980 to 1985, in 1022 J. The increased heating below 700m of about 0.2 W/m2 globally is revealed after about 2000. The orange bars show the times of the El Chichón and Pinatubo volcanic eruptions. From Trenberth & Fasullo (2013).
The increase in deep ocean heat content is also a robust result in data sets that do not include reanalysis. For example, as discussed in Nuccitelli et al. (2012), the ocean heat content data set compiled by a National Oceanographic Data Center (NODC) team led by Sydney Levitus shows that over the past decade, approximately 30 percent of ocean heat absorption has occurred in the deeper ocean layers, consistent with the results of Balmaseda et al. (2013).
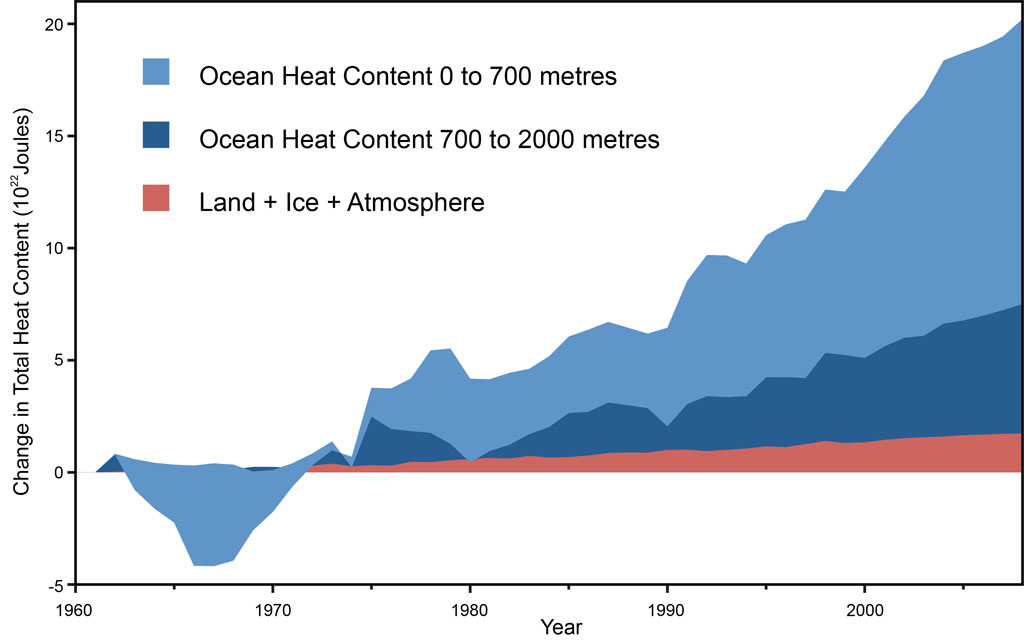
Land, atmosphere, and ice heating (red), 0-700 meter OHC increase (light blue), 700-2,000 meter OHC increase (dark blue). From Nuccitelli et al. (2012)
Similarly, a new paper by Lyman & Johnson (2013) concludes,
"In recent years, from 2004 to 2011, while the upper ocean is not warming, the ocean continues to absorb heat at depth (e.g., Levitus et al. 2012; von Schuckman and Le Traon 2011), here estimated at a rate of 0.56 W m-2 when integrating over 0–1800 m."
The paper also includes this useful table illustrating that according to observational data, ocean heat content has indeed accumulated rapidly in the deep oceans in recent years. Of the heat accumulating in the upper 1,800 meters of oceans for 2004–2011, 46 percent was sequestered in the deep oceans (below 700 meters) in the Lyman & Johnson data set.
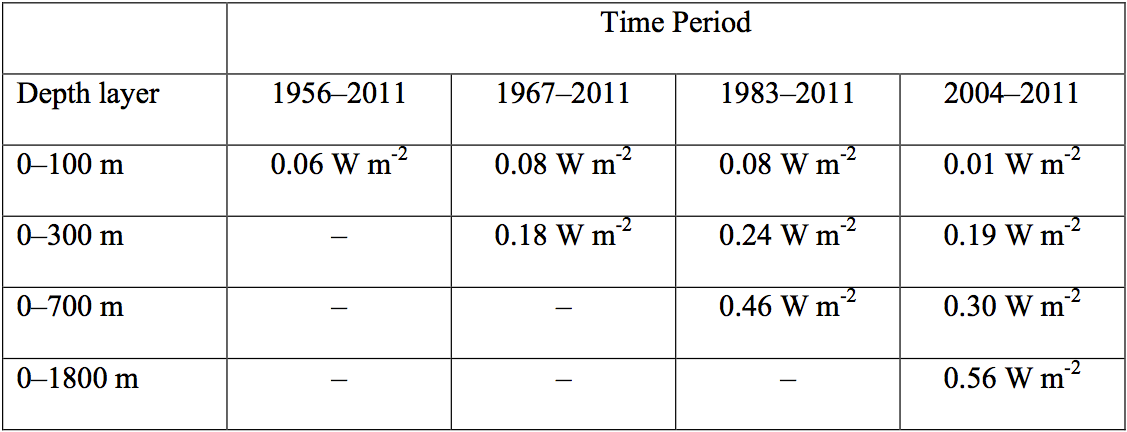
For 2004–2011, they find the oceans accumulating 0.56 W/m2 (9x10²¹ J/yr) in the upper 1,800 meters – equivalent to 4.5 Hiroshima atomic bomb detonations per second – during a time when many have argued that global warming has magically 'paused'.
There are some differences among these studies, although all agree that the deep ocean is taking up more heat recently. The differences arise from how gaps in observations are filled in time and space, and the reanalyses do this most comprehensively by utilizing all kinds of data as well as using ocean models to span gaps.
Ocean Heat Accumulation Consistent with Other Observations
We also know from satellite observations that the planet is accumulating heat owing to a global energy imbalance. A new paper by Trenberth et al. (2014) notes that the amount of heat accumulating in the global climate (most of which is absorbed by the oceans) is generally consistent with the observed global energy imbalance.
Due to the increased greenhouse effect 'trapping' more heat, there's more incoming than outgoing energy at the top of the Earth's atmosphere. That energy has to go somewhere. With over 90 percent being absorbed by the oceans, we fully expect the oceans to do exactly what they're doing – accumulate a whole lot of energy. What's more, continually increasing greenhouse gases increase the imbalance by about 0.3 W/m2 per decade even as the planet warms and radiates some extra heat back to space. If global warming were to 'pause', it would require an explanation of where the energy from the global imbalance is going.
There's also the issue of sea level rise, whose main contributors are melting glaciers and ice sheets, and thermal expansion (water expanding as it warms). Climate scientists have been able to close the sea level 'budget' by accounting for the various factors that are causing average global sea levels to rise at the measured rate of about 3.2 millimeters per year since 1992 (when altimeters were launched into space to truly measure global sea level). The warming oceans account for about 35–40% of that rate of sea level rise over the past two decades, according to the IPCC AR5. If the oceans weren't continuing to accumulate heat, sea levels would not be rising nearly as fast.
The Pause is Fictional; Ocean Warming is Factual
The bottom line is that all available information related to ocean heat content shows that the oceans and global climate continue to build up heat at a rapid pace, consistent with the global energy imbalance observed by satellites and the rate of global sea level rise. In recent years, about one-third of that heat has accumulated in the deep oceans.
While the rate of increase of global surface temperatures in recent years has slowed in large part due to the more efficient heat transfer to the deep oceans, that can't last forever. A key reason is that sea level rise occurs unevenly, and in some places, such as near the Philippines, sea level has risen over 20 cm since 1992, while in other places it has fallen slightly. In particular, the slope of the ocean surface across the Pacific has increased by 20 cm, and the water wants to slosh back but is prevented by stronger easterly trade winds. The resulting changes in ocean currents are part of the reason why more heat has gone deeper.
When that trend reverses, as past observations suggest it will (likely within the next decade, according to Trenberth & Fasullo [2013]) we'll experience an acceleration of warming at the Earth's surface.


Tom,
I wasn't selecting the data for any reason except to duplicate the graphic produced in Nuttecelli 2012. in this effort I was (mostly) successful
click for larger image
http://oi57.tinypic.com/2iu2gs9.jpg years 1978-2008
http://oi62.tinypic.com/2jfg4tk.jpg years 1978-2048
I tried to calculate the energy imbalance based on this updated graph from Levitus et al. 2012. Each data point is a 5-year average, so the last point (2011) covers the period 2009-2013. This is my result:
There is of course a significant uncertainty in these numbers, but they indicate that the average energy imbalance for the last decade was about twice that of the last 50 years.
According to figure 10 in James Hansen's Earth's energy imbalance and implications the contribution from oceans deeper than 2000 m and around Antarctica is slightly less than 0.1 Watt/m2 and from non-ocean about 0.06-0.07 W/m2. That brings the total energy imbalance for the last decade up to about 0.65-0.7 W/m2.
What I find most striking is the fact that even if the atmospheric warming in the last decade had continued at the same rate as before 2000 (0.2oC/decade), this would only add about 1 percent (!!) to the present energy imbalance.
Therefore a "hiatus" in the surface warming does not disprove AGW as long as the oceans continue to warm at their present rate!
jja @51, I am having a great deal of difficulty reproducing your results. Specifically, you have not specified an origin for your formulas discussed in previous posts, and using 0 AD (=1 BC) as the origin gives nonsense results using those formalas. Further, using your formula for the TOA flux of y=.1243*x^2 - .2485*x +.2175 does not yield sensible results for any choice of origin if I use years as the units of the x axis.
Can you please confirm that that is the correct formula, and specify units and origin for the x-axis?
HK@52,
If read literally - i.e. if atmospheric warming was higher, then Earth energy imbalance (TOA) would increase marginally, by 1% - it would contradict the basics of IR radiation theory. Increased atmospheric temperature results with more energy loss due to IR and that should lead to the decrease of global "energy imbalance", as defined in this article (TOA energy budget measured by satelites), contradicting your statement.
I read it as such but then I realised that of course by the "energy imbalance" you must mean the "measure of heat accumulation". Then your statement is true and supports your conclusion.
So beware to describe your concepts precisely, otherwise people like me won't understand you. Or worse: the denialists will pick up on your words and spin the story against you.
Tom,
The function that you are using plots the decadel energy deposition in Watts/m^2
y=.1243*x^2 - .2485*x +.2175
The values produced are
decade Energy
1 0.0933
2 0.2177
3 0.5907
4 1.2123
5 2.0825
6 3.2013
7 4.5687
To reproduce the graph, take the above values and convert from annual average W/m^2 to decadel total energy deposition
use the following conversion: Total Energy per decade = ((TOA)/(.62*10))*1E22
This produces the following values for total energy added in each decade:
Decade Energy added in the Decade
1 1.50E+22
2 3.51E+22
3 9.53E+22
4 1.96E+23
5 3.36E+23
6 5.16E+23
7 7.37E+23
The first data point is 1978 which began at 5.5E22joules
1978 5.5E22joules
Then add the first decades value to 1978 to get the 1988 value
1988 7E22joules Then add the next decade value to the 1988 value
1998 10.51joules and so on to produce the final values
year energy value
1978 5.5E+22
1988 7.005E+22
1998 1.052E+23
2008 2.004E+23
2018 3.96E+23
2028 7.319E+23
2038 1.248E+24
2048 1.985E+24
incidentally, I performed another test that added the 1968 value of -4E22 and found the following function that produced a higher energy deposition rate in future years. Both of these functions produce a current TOA that is within the error range estimation of Hansen and Soto for their 2008 average. What is very interesting is how rapidly this TOA is rising as the global temperature surface temperatures have stabilized.
I consider this to be a high-range estimate and the previous to be the mid-response estimate.
http://oi60.tinypic.com/2z4lfkp.jpg
geez, sorry
Total Energy per decade = ((TOA)/(.62))*10YEARS*1E22
jja @56, sorry, I was insufficiently clear.
I understand that your equation for TOA flux is:
y=0.1243*x^2 - 0.2485*x +0.2175
where y is the TOA flux, and x is the date.
When I plug that equation in using years AD for X, I get values of the order of 500,000. I am sure you will agree that is absurd. Consequently I tried subtracting 1977 from AD for years on the assumption that years are numbered over the period of interest. In that case, 2008 has a "TOA flux" ~116 W/m^2 which is again absurd. At that stage I have assumed that you are not using years as a unit, and have asked for the units for duration (x-axis) and the origen for the x-axis expressed in terms of AD.
Chriskoz#54
I understand that warming of the atmosphere will increase heat loss to space and therefore decrease the energy imbalance & heat accumulation in the climate system as a whole.
My point was that if the atmospheric warming still was 0.2oC/decade, this would produce an energy imbalance of only 0.006 W/m2, or about 1% of the energy imbalance in the rest of the climate system if that had continued to warm at its present rate.
Tom@57
decade Energy
1 0.0933
2 0.2177
3 0.5907
4 1.2123
5 2.0825
6 3.2013
7 4.5687
Hansen & Soto have the average 2005-2010 (average time=June 2008) of .581 (W/m^2) - see figure 10.b
End of year TOA
1988 0.0933
1989 0.094553
1990 0.098292
1991 0.104517
1992 0.113228
1993 0.124425
1994 0.138108
1995 0.154277
1996 0.172932
1997 0.194073
1998 0.2177
1999 0.243813
2000 0.272412
2001 0.303497
2002 0.337068
2003 0.373125
2004 0.411668
2005 0.452697
2006 0.496212
2007 0.542213 Hansen & Soto Value fits
2008 0.5907 inbetween these two years.
2009 0.641673
2010 0.695132
2011 0.751077
2012 0.809508
2013 0.870425
2014 0.933828
2015 0.999717
2016 1.068092
2017 1.138953
2018 1.2123
jja, what I have been attempting to do, was to apply your formula to the entire record from Nucutelli et al (2012). To do that, I modified your formula to give annual values rather than decadal averages. I did that by using replacing x at each occurence with (year AD - 1973)/10. I chose 1973 rather than 1978 to compensate for the fact that you use a decadal average rather than an annual average. I then calculated the cumulative energy for the entire period of the record.
Frankly, the modified formula (Quadratic) performed poorly over that interval, so I also tried your modified formula plus a linear trend in energy with the trend tuned give the correct values in 1978 and 2008 (Quad+Linear). I compared both of these to a linear trend in OHC, equivalent to an approximately constant energy imbalance over the period (Linear Trend). Here are the results:
|| Linear Trend || Quadratic || Quad+Linear || Short Quad || Short Linear
R^2 || 0.930 || 0.907 || 0.891 || 0.959 || 0.934
RMSE || 1.807 || 5.620 || 2.733 || 1.115 || 1.521
As you can see, Linear Trend performs better than either Quadratic or Quad+Linear both in respect to R Squared, and significantly better with respect to Root Mean Squared Error. I also compared the linear trend with the modified formula over just the 1978-2008 interval (Short Quad and Short Linear). In this case the modified formula performed better. That, however, is in part to the 1978 figure being set to the correct value from observations, gauranteeing zero error for that value, and minimal error for close values. It is also in part because I did not recalculate the linear trend for the shorter interval, so while the modified formula was tuned for that interval, the linear trend was not.
These results show that your formula only appears to have a good fit because it is fitted to only part of the data, and not compared to the rest of the data. The quality of the apparent fit is then exagerated by only comparing decadal averages. As it is decadal averages of a 5 year smooth, that makes it an effective 15 year weighted smooth, and smoothing always exagerates correlation as measured by R (or R squared). Further, the modified formula is significantly more complex than the linear fit and therefore, by Okham's razor is to be preferred if there is no clear advantage in fit. Consequently I believe it is preferrable even over the short interval, although I have not applied any statistical test of relative fit to complexity such as the AIC.
I am, of course, amenable to modifying your formula as you suggest provided that it gives annual values and covers the full range of data. If you think you can find a better fit than the linear fit for that period, I am certainly interested. But your formula does not cover all the data, and has a poor fit when it is extended to do so. It is therefore not projectible.
Tom@61
interesting! do you have an image of the plot you generated? the quad/linear function sounds interesting. Of course, this is simply a curve-fitting exercise and can, in no way, accurately provide a convincing tool for projecting future TOA or Heat Accumulation values. This is why even Hansen and Soto show three different projected future TOA values based on the bio-response to increased heat (quick response-high warming leads to lower TOA while a slow response-low warming leads to higher TOAs).
However, we do have the benefit to understand that, after the early 1970's the removal of sulfur dioxide emissions for coal fired plants significantly reduced the aerosol negative forcing (allowing for the large rate of increase in the 1968-1978 decade.
This is why I had originally skipped this period. The values are skewed.
From 1978 to 2008 the function that I developed (from three points!) is simplistic but tracks the heat values at a very high rate, in fact, I have basically duplicated the Soto Hansen results using this function.
This doesn't mean that the current trend of doubling TOA every 9 years is coing to be maintained going forward. Another 1998-grade el nino event would lead to a jump in atmospheric temperatures and a pause in the growth of TOA.
however, it appears to be consistent with the data that is most recent in the record (1998 to present).
by the way,
the annual values are generated by adding a decimal to the decade values.
1 = 1978
1.1 = 1979
1.2 = 1980 etc. . .
This is the actual function that I used to duplicate Nutticelli et. al. You can check it and use the tenths decimal to get individual year values.
y = (6.683E+21)*D4^3 - (3.006E+22)*D4^2 + (5.846E+22)*D4 + 1.992E+22
again, use the value x = 1 for 1978, x=1.1 for 1979 and so on. . .
--again, I wouldn't use the pre 1978 values because of changes in smokestack emissions and the relatively lower TOA at the time.
between 1978 and 2008
R^2 is 0.939
Standard Error is 1.556E+22
How do we know how long this negative PDO phase will last or what causes it? Maybe global warming has messed up the PDO cycles and has shifted them permanently negative, effectively creating a negative feedback to increasing global surface temperatures. The Bering Sea is experiencing unprecedented record cold temperatures. Couldn't the deep oceans absorb all the increased heating from future AGW?
Even if PDO stayed negative (highly unlikely given our understanding of ENSO), how does it create a negative feedback? If you draw a trendline through only the La Nina years, then you get trend pretty much same as average long term trend.
The deep ocean can only absorb more heat if you can dream up a mechanism that will transport heat from surface to the deep somewhat faster than mechanisms at work today - and that would only be temporary. This would still result in sealevel rise (from expansion of water as it warms) and hasten the point at which oceans reach limit for absorbing CO2 and outgas CO2 (currently probably hundreds of years away).
Elmwood,
You got the sign wrong. The Bearing Sea is recording record warm temperatures this year. The past couple of years were slightly cold, but that changed this year. Perhaps it is due to natural variation. See this graph (unfortunately it is only a one day graph, the NOAA web site was having some problem today with the longer term graphs). This Canada Sea Ice graph (one week old), shows Barrow as 13C above average for a week (that is 23F for the whole week). Can you provide data to support your wild claim of record cold? It is record warm in all of Alaska.
michael,
i thought i heard that the bering sea was still colder than normal on the radio (i live in anchorage). we did have near record warm last month but now it's probably below normal if anything. i've never seen a january or february with so little snow, it all melted. big oil up here has every politician in their pockets. i work in this industry as a government regulator and naturally have a lot of interest in this subject. just trying to find any weaknesses in the theory of AGW. so far i haven't found any. thanks.
Elmwood,
Neven's Arctic Sea Ice Graphs page has a lot of graphs that cover Alaska. If you are a casual reader there are a lot of graphs to look through. This page shows the daily and weekly sea temperature anomalies worldwide. It currently shows the Bearing sea as warm. I do not remember a week this year when the Bearing sea was cold, it has been warm or neutral. There is a large hot spot south of Alaska in the North Pacific ocean. It has been there for months.
Yesterdays temperature anomaly plot for the entire world shows Anchorage cool as you describe. The weekly product is still not working.
I imagine your news sources are fairly biased in Alaska. This is a good site to ask questions. We all are interested in weaknesses, they show areas you can learn more.
It isn't a direct measure of temperature, but Bering sea ice is currently very low for this time of year.
This winter a lot of warm air has been pulled up into the Arctic... which in turn has pushed cold air down into the eastern U.S. Climate deniers have been out in force in my area, 'Look, snow! So much for global warming'... yet I can remember that 30 years ago the winters were routinely colder and more snow covered even than this. The fact that the Arctic has seen an abnormally warm winter could also lead to a large sea ice melt this summer.
To your point, CBD...:/
http://xkcd.com/1321/