Climate Science Glossary

Term Lookup

Enter a term in the search box to find its definition.

Settings

Use the controls in the far right panel to increase or decrease the number of terms automatically displayed (or to completely turn that feature off).

Term Lookup

Settings


All IPCC definitions taken from Climate Change 2007: The Physical Science Basis. Working Group I Contribution to the Fourth Assessment Report of the Intergovernmental Panel on Climate Change, Annex I, Glossary, pp. 941-954. Cambridge University Press.

Home Arguments Software Resources Comments The Consensus Project Translations About Support

Bluesky Facebook LinkedIn Mastodon MeWe

Twitter YouTube RSS Posts RSS Comments Email Subscribe


Climate's changed before
It's the sun
It's not bad
There is no consensus
It's cooling
Models are unreliable
Temp record is unreliable
Animals and plants can adapt
It hasn't warmed since 1998
Antarctica is gaining ice
View All Arguments...


Username
Password
New? Register here
Forgot your password?

Latest Posts

Archives

Global warming and the El Niño Southern Oscillation

Posted on 29 July 2009 by John Cook

An old chestnut is climbing up the skeptic leaderboard: the El Niño Southern Oscillation. This is due to a new paper published in the Journal of Geophysical Research: Influence of the Southern Oscillation on tropospheric temperature (McLean 2009). What does the paper find? According to co-author Bob Carter, “The close relationship between ENSO and global temperature, as described in the paper, leaves little room for any warming driven by human carbon dioxide emissions." In other words, they claim that any global warming over the past few decades can be explained by El Niño activity.

How do they arrive at this conclusion? They begin by comparing satellite measurements of tropospheric temperature to El Niño activity. Figure 1 plots a 12 month running average of Global Tropospheric Temperature Anomaly (GTTA, the light grey line) and the Southern Oscillation Index (SOI, the black line).
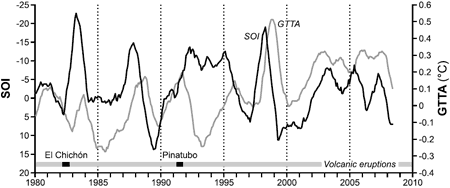

Figure 1: Twelve-month running means of SOI (dark line) and MSU GTTA (light line) for the period 1980 to 2006 with major periods of volcanic activity indicated (McLean 2009).

The Southern Oscillation Index shows no long term trend (hence the term Oscillation) while the temperature record shows a long term warming trend. Consequently, they find only a weak correlation between temperature and SOI. Next, they compare derivative values of SOI and GTTA. This is done by subtracting the 12 month running average from the same average 1 year later. They do this to "remove the noise" from the data. They fail to mention it also removes any linear trend, which is obvious from just a few steps of basic arithmetic. It is also visually apparent when comparing the SOI derivative to the GTTA derivative in Figure 2:
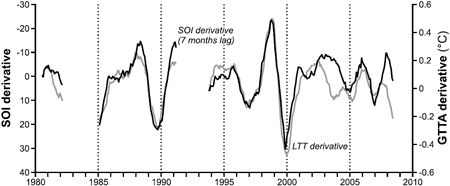

Figure 2: Derivatives of SOI (dark line) and MSU GTTA (light line) for the period 1981–2007 after removing periods of volcanic influence (McLean 2009).

The linear warming trend has been removed from the temperature record, resulting in a close correlation between the filtered temperature and SOI. The implications from this analysis should be readily apparent. El Niño has a strong short term effect on global temperature but cannot explain the long term trend. In fact, this is a point made repeatedly on this website (eg - here and here).

This view is confirmed in other analyses. Hoerling 2008 examines the temperature record from 1880 to 2007 and finds internal variability such as El Nino has relatively small impact on the long term trend. Instead, they find long term trends in sea surface temperatures are driven predominantly by the planet's energy imbalance.

There have been various attempts to filter out the ENSO signal from the temperature record. We've examined one such paper by Fawcett 2007 when addressing the global warming stopped in 1998 argument. Similarly, Thompson 2008 filters out the ENSO signal from the temperature record. What remains is a warming trend with less variability:
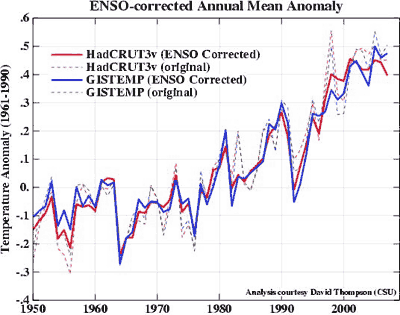

Figure 3: Surface air temperature records with ENSO signal removed. HadCRUT corrections by Thompson 2008, GISTEMP corrections by Real Climate.

Ultimately, all the data analysis shouldn't distract us from the physical reality of what is happening to our climate. Over the past 4 decades, oceans all over the globe have been accumulating heat (Levitus 2008). The El Niño Southern Oscillation is an internal phenomenon where heat is exchanged between the atmosphere and ocean and cannot explain an overall buildup of global ocean heat. This points to an energy imbalance responsible for the long term trend (Wong 2005).
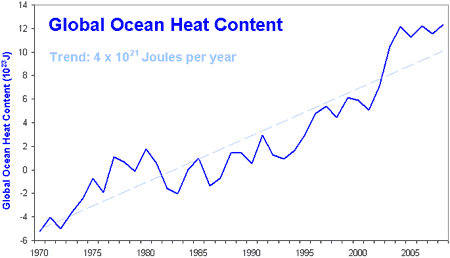

Figure 4: Global ocean heat from 1970 to 2008. Dark blue line is yearly ocean heat content for the 0–700 m layer. Light blue line is linear trend (Levitus 2008).

Data analysis, physical observations and basic arithmetic all show ENSO cannot explain the long term warming trend over the past few decades. Hence the irony in Bob Carter's conclusion "The close relationship between ENSO and global temperature leaves little room for any warming driven by human carbon dioxide emissions". What his paper actually proves is once you remove any long term warming trend from the temperature record, it leaves little room for any warming.


UPDATE 7 August 2009: A comment has been submitted to the Journal of Geophysical Research: Comment on “Influence of the Southern Oscillation on tropospheric temperature” by J. D. McLean, C. R. de Freitas, and R. M. Carter (Foster et al 2009). An excerpt from the abstract:

This comment first briefly reviews what is understood about the influence of ENSO on global temperatures, then goes on to show that the analysis of MFC09 severely overestimates the correlation between temperature anomalies and the SOI by inflating the power in the 2–6 year time window while filtering out variability on longer and shorter time scales. It is only because of this faulty analysis that they are able to claim such extremely high correlations. The suggestion in their conclusions that ENSO may be a major contributor to recent trends in global temperature is not supported by their analysis or any physical theory presented in that paper, especially as the analysis method itself eliminates the influence of trends on the purported correlations.

They talk about the 24 hour news cycle. Considering the speediness of the response, I wonder if we're heading towards a 24 hour science cycle.

0 0

Printable Version  |  Link to this page

Comments

Prev  1  2  

Comments 51 to 71 out of 71:

  1. "I was not however talking about trends but about total heat content of the climate system and how it is evidently not increasing." This is a self-contradictory statement. To say something is "not increasing" *is* a statement about trends. Basic logic failure there. Were thingadonta's absurd statements about Hensen "polite discourse"? Or is ad hominem only a bad thing only when it is directed to you? I consider making provably false statements (as you repeatedly do) to be impolite. If you don't like my tone that's your problem.
    0 0
  2. Should I say I was not talking about trends in a single factor - either atmospheric or ocean temps - but about both. I think that should be fairly evident in context. You make statements that are arrogant, uninformed, juvenile and facile. Nothing with any mature science content or depth of understanding that can be responded to at any sensible level. The comments by Thingadonta about Hansen were in the context of an argument on the issues. Simply mentioning a name in a context of sidcussion on relevant points is not an ad hominem argument. There was no personal attack on Hansen. But to respond in terms such as gibberish, ranting and bizarre says more about you than anything else. I politely keep correcting your misconceptions without making much of an issue of it - but you insist on responding in personal terms - and as I say without any correct science content.
    0 0
  3. http://ipcc-wg1.ucar.edu/wg1/Report/AR4WG1_Print_SPM.pdf http://www.nasa.gov/centers/goddard/images/content/93620main_sun5m.jpg solar irradiance changes – AR4: 0.12 W/m2 increase – NASA: 0.8 W/m2 increase minima to minima from the late 1970’s. ‘Since the late 1970s, the amount of solar radiation the sun emits, during times of quiet sunspot activity, has increased by nearly .05 percent per decade, according to a NASA funded study.’ IPCC confidence estimate – low Direct aerosols – AR4: -0.5 W/m2 – Myhre et al 2009*: -0.3 W/ms2 IPCC confidence estimate – medium to low *Comparison of the radiative properties and direct radiative effect of aerosols from a global aerosol model and remote sensing data over ocean cloud albedo – AR4: -0.7 W/m2 – Goode and Palle 2008*: +3.7 W/m2 from 1984 to 1998 and -2 W/m2 from 1998 to 2008. IPCC confidence low *Inter-annual trends in earth's reflectance1999-2007, E. Palle, P. Montanes-Rodriguez, P.R. Goode, Journal of Geophysical Research Are James Hansen and the IPCC incorrect? Only if they fail to incorporate new data into their thinking – and this seems very much to be the case for many global warming activists around the world.
    0 0
  4. "There was no personal attack on Hansen. " Really? "... self-perpetuating idea guru Hansen" seems pretty personal. As for "understanding", well, you have yet to demonstrate any. This blog post was about the errors in McLean et al. Errors which you still have not acknowledged. Until you do, you have zero credibility and have demonstrated zero understanding. Verbosity is not understanding. The ability to use a search engine is not understanding. You demonstrate *nothing* except persistence in the absence of evidence. But I'm off for an extended hiking trip and won't be around for months (unless I come across an internet cafe somewhere in the Andes...) so I'll leave you to your little denialist fantasy world.
    0 0
  5. re:50 You shouldnt automatically dismiss everything you don't immediately understand. This issue is discussed in previous post, regarding solar heat lag. Hansens 2005 paper failed to address the increase in solar activiy between 1750-1950 and how this affects the oceans, which have a long lag time, potentially leading to an apparent 'energy imbalance'. This measured heat content of the oceans and the increase from 1955-1998 was inferred by Hansen to be due to greenhouse gases, however there is no mention in the paper, or the press release of how oceans interact long term with increase in output from the sun. From this apparent 'heat imbalance', he further infers a 'climate disequilibrium', and also predicts record breaking T in the first decade of the 2000s, which didnt happen, nor did he predict the flattening of ocean T, in line with a flattening solar output. His entire argument may be wrong-ie the 'imbalance' could be a case of solar heat lag effects, and there is therefore no climate disequilibrium. Because he doesn't bother with the suns effects, which are known to have heat lags, it is wilful ignorance, which stems from ideology. This only remotely has to do with ENSO/PDO and Mclean et al 2009 because the oceans are important in all this, and the increase in the long term trend may be a lag effect from the sun. But Mcleans paper is about short term effects.
    0 0
  6. Thingadonta - you should really check out the NASA site and study on TSI. There is a trend in TSI of about 0.7 W/m2 per decade from the start of satellite measurements in the late 1970's. Quite significant on top of the increase from 1850. There is still nothing here but kneejerk reaction to the McLean et al paper. The paper shows what is obvious - a close correlation of ENSO to global temperature. They speculate - not only allowable but essential in any scientific publication in exploring other connections - that the decadal variation in ocean temperature as a result of conditions during and after the 'Pacific Climate Shift' impacted on global surface temperature in the period 1976 to 1998. Decadal variaitions in ENSO have an impact on surface temperature trends obviously - because the Pacific Ocean climate satate has reverted to a cool La Nina mode since 1998 and the planet is cooling. Posit another rational explantion - please? Is Alliecat typical of global whiners? A science free zone, specialises in insults and is off trekking in South America. Why am I not surprised?
    0 0
  7. Thingadonta - you may find this relevant - I believe it is to be publishd tomorrow but there is a preview at WUWT. It links the decadal ocean cycles with Earth's radiative imbalance - that is the radiative imbalance changes sign with the cycles - and discusses lags as well. I must actually read the whole thing before making any comment however. Cheers Robbo ‘Ocean heat content and Earth’s radiation imbalance D.H. Douglass and R, S, Knox Dept. of Physics and Astronomy, University of Rochester, PO Box 270171, Rochester, NY 14627-0171, USA We determine Earth’s radiation imbalance by analyzing three recent independent observational ocean heat content determinations for the period 1950 to 2008 and compare the results with direct measurements by satellites. A large annual term is found in both the implied radiation imbalance and the direct measurements. Its magnitude and phase confirm earlier observations that delivery of the energy to the ocean is rapid, thus eliminating the possibility of long time constants associated with the bulk of the heat transferred. Longer-term averages of the observed imbalance are not only many-fold smaller than theoretically derived values, but also oscillate in sign. These facts are not found among the theoretical predictions. Three distinct time intervals of alternating positive and negative imbalance are found: 1960 to the mid 1970s, the mid 1970s to 2000 and 2001 to present. The respective mean values of radiation imbalance are −0.15, +0.15, and −0.2 to −0.3. These observations are consistent with the occurrence of climate shifts at 1960, the mid-1970s, and early 2001 identified by Swanson and Tsonis.’ http://wattsupwiththat.com/2009/08/11/ocean-heat-content-and-earth%E2%80%99s-radiation-imbalance/
    0 0
  8. Wow. I can't believe there's still someone clinging to McLean et al. after such a thorough debunking. Old habits die hard. Wattsupwiththat? thingadonta, Solar variation has been addressed on many occasions in the peer-reviewed science. The contribution in recent decades is negligible or that of cooling. The "long lag" assumption (Scafetta) doesn't hold water. http://www.realclimate.org/index.php/archives/2006/03/solar-variability-statistics-vs-physics-2nd-round/ Recent study that exposes some of these assumptions: http://www.agu.org/pubs/crossref/2009/2008JD011639.shtml Others: http://www.gfy.ku.dk/~kaas/forc&feedb2008/Articles/Lockwood&Froehlich2007.pdf http://www.pnas.org/content/104/10/3713.full.pdf "He also has completely failed in his predictions of T since that time, which were based on the inferences in his 2005 paper." You're seriously attempting to evaluate climate predictions based on 3-4 years?
    0 0
  9. "This blog post was about the errors in McLean et al." I thought the topic of discussion was . This often becomes the case when their arguments are refuted. Spin the "Hottest Skeptic Arguments" wheel and try again...
    0 0
  10. thingadonta (#62): "I didn't say that he said 'the sun had nothing to do with it'," thingadonta (#49): "which in turn was made from his inference about a 'heat imbalance', which in turn was made from his inference that the sun had nothing to do with it," thingadonta (#62): "he merely completely failed to address long term (and short term) solar changes in his 2005 paper." I have the paper right in front of me. A quote: "Solar irradiance is taken as increasing by 0.22 W/m2 between 1880 and 2003, with an estimated uncertainty of a factor of 2 (9)." from the abstract... "Our climate model, driven mainly by increasing human-made greenhouse gases and aerosols, AMONG OTHER FORCINGS, calculates that Earth is now absorbing 0.85 T 0.15 watts per square meter more energy from the Sun than it is emitting to space. This IMBALANCE is confirmed..." (CAPS are my emphasis) http://pubs.giss.nasa.gov/docs/2005/2005_Hansen_etal_1.pdf One might also want to read the GISS 2008 surface temperature analysis. http://data.giss.nasa.gov/gistemp/2008/ I encourage all skeptics seeking truth to avoid getting their views of the science from unreliable blogs (or at least take a long break from them), which often distort reality and create strawman arguments. This especially seems to be the case with regards to any work or quotes by Dr. Hansen. Instead, subscribe to a few scientific journals, spend a few weekends reading the IPCC report and references, and keep an open mind.
    0 0
  11. Your assertions simply don’t accord with the facts thingadonta. It’s a continual reassertion, over and over, of things that are simply not true. Hansens’ analysis of attributions to 20th century warming include all of the known contributions based on the individually parameterized estimates from the relevant scientists working on the particular area (solar scientists, or scientists that study aerosol contributions and so on). The contributions modelled in the analysis of Hansen and his collaborators are solar, greenhouse gases, natural and anthropogenic aerosols, land use changes, black carbon, ozone, stratospheric ozone… Since these are described explicitly, it doesn’t make sense to continually deny what is right there on the page: http://pubs.giss.nasa.gov/docs/2005/2005_Hansen_etal_1.pdf you can look at the specific attribution of parameterizations in mind-numbing detail in the papers describing the attributions; e.g.: http://pubs.giss.nasa.gov/docs/2005/2005_Hansen_etal_2.pdf Since Hansen is not a solar scientist, it makes sense for him and his colleagues to parameterize solar contributions based on the best estimates of solar contributions determined by solar scientists. These data are determined by Lean and colleagues, by Solanki and his group, by Foukal, by Lockwood and their colleagues and so on. These analysis demonstrate that the solar contributions to 20th century warming are small. The entire solar contribution since the depths of the Maunder minimum are likely no more than 0.2 oC. The solar contribution to 20th century warming is most likely less than 0.1 oC (pretty much all of it realized before that very marked onset of late 20th century warming) [*]. So there simply hasn’t been a strong solar contribution to 20th century warming. There was a small contribution in the first part of the century corresponding to something like 0.1 oC. The solar contribution since the early 1980’s has been a tad negative. Altogether the 20th century solar contribution has likely been below 0.1 oC. That’s simply what the science indicates thingadonta, and it would be foolish for Hansen not to use the best data in his parameterizations. I don't see any point in continually denying this! As for lags, we’ve been through this already. The maximum rate of response to a change in forcing occurs essentially immediately when there is the greatest difference between the pre-existing temperature and the new equilibrium temperature to which the earth’s surface will tend under the influence of the forcing. Since the solar output increased somewhat between 1900 and 1950 (it maxed around 1950), and the total contribution to surface warming at equilibrium from that change in forcing is no more than 0.1 oC, we expect that a good bit of this was achieved by 1950 (say 0.04 oC) and by the early 1970’s we’d likely had 0.06 oC of this. Any contribution to the warming of the last 30-odd years was simply insignificant. That's what the science indicates. There doesn't seem to be any good reason for denying the evidence. ---------------------------------------- [*]J. L. Lean and D. H. Rind (2008) “How natural and anthropogenic influences alter global and regional surface temperatures: 1889 to 2006″, Geophys. Res. Lett.35, L18701., who conclude their analysis with:
    “For the ninety years from 1906 to 1996, the average slope of the anthropogenic–related temperature change in Figure 3d is 0.045 K per decade whereas Allen et al. [2006] concluded that the rate is 0.03–0.05 K per decade for this same period. Solar-induced warming is almost an order of magnitude smaller."
    In other words around 0.05 oC solar contribution to warming during period 1906-1996. L. Balmaceda, N.A. Krivova and S.K. Solanki (2007) “Reconstruction of solar irradiance using the Group sunspot number” Advances in Space Research 40, 986-989
    Abstract: We present a reconstruction of total solar irradiance since 1610 to the present based on variations of the surface distribution of the solar magnetic field. The latter is calculated from the historical record of the Group sunspot number using a simple but consistent physical model. Our model successfully reproduces three independent data sets: total solar irradiance measurements available since 1978, total photospheric magnetic flux from 1974 and the open magnetic flux since 1868 (as empirically reconstructed from the geomagnetic aa-index). The model predicts an increase in the total solar irradiance since the Maunder Minimum of about 1.3 Wm−2.
    1.3 W/m2 since the 17th century Maunder minimum is equivalent to a warming contribution of around 0.2 oC [1.3 * 0.25 (geometry)* 0.7 (albedo)* 0.8 (sensitivity)] over this entire period of which 0.1 oC or less is 20th century. And so on.
    0 0
  12. The IPCC assesses the level of scientific understanding of solar irradiance changes as low. Chris can obviously improve on that with such confidence. How the hell could solar irradiance peak in 1950 if it was increasing from the beginning of satellitte observations in the late 1970's - by 0,05%/decade - 0.8 W/m2 minima to minima. Solar irradiance changes are the cause of 25 to 50% of temp changes from the LIA. You calculate that yourself - albeit at the lower end of the estimates. Calculating TSI change from sunspot numbers? Gee that must be accurate. Idiot.
    0 0
    Response: Play nice, children. I would suggest you read some of the work of Sami Solanki (eg - Usoskin 2005, Solanki 2004, Solanki 2003 and much much more...), one of the world's leading solar researchers, who has done much work modelling solar activity and constraining the results with proxies like sunspot numbers. I would also suggest an overview of the data on the long term solar trend.
  13. oh dear Robbo.. swearing, arch attempts at "irony" and ad hominem - that's not very convincing. Apart from that I don't understand your angst. The situation concerning solar outputs have clarified even in the few years since the "cut-off" for consideration of data for the latest IPCC reports. There has been no significant secular trend in the solar outputs since the mid 20th century, and analysis of all of the solar outputs (the open solar flux; the international sunspot number; the cosmic ray flux; the total solar irradiance) indicates that the solar outputs have been in a cooling direction since around the mid-1980's [*]. That's simply what a direct inspection of the sun shows. I don't see any point in pretending that that's not what the evidence shows. Even the group that might seem to have most interest in displaying solar contributions (Svensmark) has made an analysis of the CRF variation since the late 1950's and has shown that this has been flat (tending if anything in a cooling direction since that time (last 50 years): http://www.spacecenter.dk/publications/scientific-report-series/Scient_No._3.pdf In addition to the TSI reconstructions of Lean and Solanki in my post above, each of which come to the same conclusion about the solar contribution (around 0.2 oC of warming contribution since the Maunder Minimum with at least half of this before the start of thre 20th century and effectively no solar contribution to the very marked warming of the last 40 years, both the groups of Foukal [**] and Benestad [***] indicate only a small solar contribution to 20th century warming (perhaps 10%, essentially all of this pre-1950). At some point you have to take the science and its evidence into account Robbo. All the solar scientists come up with a very small 20th century solar contribution from whatever direction they approach this. Calling someone an "idiot" because they point out the relevant science is not going to make the sun shine any hotter! [*] Lockwood M and Frohlich C (2007) Recent oppositely directed trends in solar climate forcings and the global mean surface air temperature Proc. Royal Society A-Mathematical Physical And Engineering Sciences 463, 2447-2460
    Abstract: There is considerable evidence for solar influence on the Earth's pre-industrial climate and the Sun may well have been a factor in post-industrial climate change in the first half of the last century. Here we show that over the past 20 years, all the trends in the Sun that could have had an influence on the Earth's climate have been in the opposite direction to that required to explain the observed rise in global mean temperatures.
    [**] P. Foukal, G. North, Tom Wigley (2004) A Stellar View on Solar Variations and Climate. Science 306, 68-69. [***]Benestad RE and Schmidt GA (2009) Solar trends and global warming J. Geophys. Res. 114 Article Number: D14101
    Abstract: We use a suite of global climate model simulations for the 20th century to assess the contribution of solar forcing to the past trends in the global mean temperature. In particular, we examine how robust different published methodologies are at detecting and attributing solar-related climate change in the presence of intrinsic climate variability and multiple forcings. We demonstrate that naive application of linear analytical methods such as regression gives nonrobust results. We also demonstrate that the methodologies used by Scafetta and West (2005, 2006a, 2006b, 2007, 2008) are not robust to these same factors and that their error bars are significantly larger than reported. Our analysis shows that the most likely contribution from solar forcing a global warming is 7 +/- 1% for the 20th century and is negligible for warming since 1980.
    and so on…
    0 0
    Response: I've added Benestad 2009 to the list of peer reviewed papers on It's the Sun. Thanks for the heads up.
  14. I apologise for name calling - I regretted it instantly. Frustration at a discussion that has no solid ground and goes nowhere. ‘The estimated direct radiative forcing due to changes in the solar output since 1750 is +0.12 [+0.06 to +0.3] W m–2, which is less than half of the estimate given in the TAR, with a low level of scientific understanding.’ 4AR However, I wasn’t being ironic at all. A misplaced confidence in selective bits of ‘the science’ without a critical analysis of the sources, error bounds and methods of data manipulations – as well as patience for the normal modes of scientific discourse to take their course - leads to dogmatism rather than scientific objectivity. This is especially the case with models. These are sometimes called experiments – but are more in the nature of thought experiments that are, inherently, not falsifiable with our current understandings. The models are numerical embodiments of the theories of their proponents. They are emphatically not empirical science at this stage but merely hypothesis. It is important to understand the distinction. The direct observations of the TSI during the past 20 years have produced an enormous advance in the understanding of its variability. However, these results open new questions, and some of them are addressed below. For instance, Willson (1997), Willson and Mordvinov (2003) in his composite series found a secular upward trend of 0.05% per decade between the consecutive solar cycles 22 and 23, while Frohlich and Lean (1998) and Frohlich (2000) in their composite series do not see such change. These results are proposing either an increasing, or a constant radiative output of the quite Sun. The F&L paper uses a disputed Nimbus 7 adjustment that is disputed. SCAFETTA’S RESPONSE TO LOCKWOOD AND FROLICH ‘Lockwood and Frolich are using the PMOD TSI composite (prepared by Frolich himself) to deduce their conclusions. By using ACRIM TSI composite (prepared by Willson) the result would be quite different. Lockwood and Frolich just ʺassumeʺ that ACRIM is wrong and PMOD is right, and do not care to repeat their calculation with the ACRIM TSI composite.’ Apart from the methodological issues – I have always wondered about the essential premise – that global temps have continued to increase after the solar downturn in the 1990’s. I may be wrong but – if you look at any monthly record – global temp seems to have peaked in 1998. Something that is entirely consistent with the cosmogenic isotope correlation and with a 10 year relaxation period. I will not go into the ongoing dialogue with Benastad and Scafetta on methodologies. The reference to Svensmark is odd - because it shows CRF peaking in the early 1990's - and they 'rebut their (F&L) argument comprehensively.' Solanki estimates based on his ‘physics-based reconstruction of TSI back to the Maunder Minimum suggests an increase of about 0.80 W/m2 since 1700, with the lower limit being about 0.60 W/m2. This value is much lower than in previous works that may have important implications on Sun-climate relations.’ Did solar activity peak in the 1950’s – certainly SSN peaked around 1960 – fantastic – a relaxation period of 10 years implies a climate lag during ocean heating of 50 to 100 years as Thingadonta keeps telling you. Total solar irradiance and climate Blanca Mendoza Advances in Space Research 35 (2005) 882–890 ‘The secular reconstructed TSI variations can account for a considerable part of the temperature variations of the Earth in the pre-industrial era. But even for those times the temperature changes are not fully reconstructed from TSI. Which means that other sources of solar activity as well as internal natural causes were contributing to the Earth’s temperature variability.’ During the 20th century TSI produces less than half of the observed temperature changes, confirming suggestions that for this century besides natural causes, man-made activities are contributing to the Earth’s temperature variability, particularly the latter’ Mendoza seems to bring us full circle – to the idea that other – unspecified - factors are responsible for climate variation pre industrial revolution - leaving open the possibility of GCR modulation. But also to very logical connection of greenhouse gases to temp increases between 1976 and 1998. This very logical connection lacks a key understanding, however, involving the decadal changes in World Ocean States. These changes explain, as the sulphur dioxide meme cannot, the decline in global temperature between the mid 1940’s to the mid 1970’s, a part of the increase from the mid 1970’s to the late 1990’s. It most especially provides the beginnings of an explanation for the lack of recent ocean and atmospheric warming. Unless you read some of this literature and try to puzzle through it – and in the light of Swanson and Tsonis for instance – you cannot understand a fundamental aspect of Earth climate. I have referenced these before – but they are worth spending some time on. Interdecadal variability and climate change in the eastern tropical Pacific: A review Alberto M. Mestas-Nun˜ez a,*, Arthur J. Miller b Progress in Oceanography 69 (2006) 267–284 The Significance of the 1976 Pacific Climate Shift in the Climatology of Alaska BRIAN HARTMANN AND GERD WENDLER JOURNAL OF CLIMATE VOLUME 18 p4824 Indeed Lohmann et al suggest amplification of the solar variations by varying convection patterns over multi-decadal periods. 'We detect the Schwabe, Hale, and Gleissberg cycles in the solar irradiance forcing. It is found that the patterns of SST associated with these cycles are similar when considering different time scales. For all time scales considered, the SST maps over the Pacific area are consistent with a poleward shift of the subtropical jet and a horizontal expansion, but weakening of the Hadley cell consistent with modelling studies (Haigh, 1999). The first EOF for multi-decadal time scales largely resembles the solar fingerprint. The principal component of the first EOF (Figure 4c) suggests that the warming trends since the 1970s and prior to 1940 are in accord with the Gleissberg cycle (Hoyt and Schatten, 1997). The correlation maps suggest that the multi-decadal variability associated with solar irradiance is not confined to the Northern Hemisphere, with modelling studies raising possible links with the tropical Pacific Ocean (Shindell et al., 2001a,b). Even a weak increase of SST due to direct solar forcing may enhance convection. Consequently, the Walker circulation is increased and the associated surface westward anomalous wind may be responsible for the negative SST. An increased Walker cell would be consistent with the out-of-phase relation between the Walker and Hadley cells (Wang and Weisberg, 1998).' CLIMATE SIGNATURE OF SOLAR IRRADIANCE VARIATIONS: ANALYSIS OF LONG-TERM INSTRUMENTAL, HISTORICAL, AND PROXY DATA GERRIT LOHMANN,* NOREL RIMBU and MIHAI DIMA There is an apparent link of the mulit-decadal cycles with clouds. Whether this is as internal climate dynamics or GCR moulation in one or other of the solar varibility cyle is an intersting question
    0 0
  15. re 50 You shouldn't automatically dismiss something you dont immediately understand. You have also misrepresented what I said. This issue was discussed in the previous post (climate time lag). Hansens 2005 paper completely failed to address the increase in solar output from 1750-1950 with solar heat lag efects on measured ocean heat content between 1955-1998. His argument concerning an inferred climate disequilibrium, which derives from his inferred heat imbalance, could be entirely wrong, as for one thing he did not model solar activity 1750-1950s+ with regards to the increase in ocean heat content 1955-1998. Oceans are known to exhibit long time lags. Hansen 2005, in making his inference about climate disequilibrium, completely failed to address the effects of changes in solar activity 1750-1950 on hte oceans. He solely uses greenhouse gas modelling to make this inferance of climate disequilibrium, and there is no mention or address of solar effects in either his paper, or his press release. I didn't say that he said 'the sun had nothing to do with it', he merely completely failed to address long term (and short term) solar changes in his 2005 paper. He also has completely failed in his predictions of T since that time, which were based on the inferences in his 2005 paper. This doesn't directly relate to the PDO, ENSO and McLean 2009 other than the oceans heat changes being important in both short term and long term T trends. The cause of their long term heating, and recent T flattening (not predicted by Hansens 2005 paper) is another matter.
    0 0
  16. re 50: You shouldn't automatically dismiss something you dont immediately understand. You have also misrepresented what I said. This issue was discussed in the previous post (climate time lag). You are right, we are getting off the topic. But I mention the issue of ocean heat and long term T changes in relation to the McLean et al 2009 paper, becuase the arguments used here against Mclean 2009 refer to long term T trends. I didn't say that he said 'the sun had nothing to do with it', he merely failed to address, in any way, long term (and short term) solar changes in his 2005 paper. Hansens 2005 paper failed to address the increase in solar output from ~1750-1950 with solar heat lag effects on measured increases in ocean heat content between 1955-1998. His argument concerning an inferred climate disequilibrium, which derives from his inferred heat imbalance, could both be entirely wrong, as for one thing he did not model or factor, in any way, solar activity 1750-1950s+ with regards to the increase in ocean heat content 1955-1998 and his subsequent inferred 'imbalance'. Oceans are known to exhibit long time lags. How he failed to factor the suns effects over this time baffles me. Hansen 2005, in making the 2nd major inference about climate 'disequilibrium', solely uses greenhouse gas modelling, and there is no mention or address of solar effects in either his paper, or his press release, on this second inferance. He also has failed in his predictions of T since that time (a 3rd inference!-note the self- perpetuating style: inferance on inference on inference =a gross exageration, which the greens and some academics love), which were based on these 2 inferences in his 2005 paper. Doesn't say much for the value of the paper does it? As for Mclean et al 2009 and back to reality, he simply says that short term variability is driven by natural internal factors; as far as I can see, there is no '3 inferances strike and your out' here (unlike Hansen 2005).
    0 0
  17. re 50: You shouldn't automatically dismiss something you dont immediately understand. You have also misrepresented what I said. This issue was discussed in the previous post (climate time lag). You are right, we are getting off the topic. But I mention the issue of ocean heat and long term T changes in relation to the McLean et al 2009 paper, becuase the arguments used here against Mclean 2009 refer to long term T trends. I didn't say that he said 'the sun had nothing to do with it', he merely failed to address, in any way, long term (and short term) solar changes in his 2005 paper. Hansens 2005 paper failed to address the increase in solar output from ~1750-1950 with solar heat lag effects on measured increases in ocean heat content between 1955-1998. His argument concerning an inferred climate disequilibrium, which derives from his inferred heat imbalance, could both be entirely wrong, as for one thing he did not model or factor, in any way, solar activity 1750-1950s+ with regards to the increase in ocean heat content 1955-1998 and his subsequent inferred 'imbalance'. Oceans are known to exhibit long time lags. How he failed to factor the suns effects over this time baffles me. Hansen 2005, in making the 2nd major inference about climate 'disequilibrium', solely uses greenhouse gas modelling, and there is no mention or address of solar effects in either his paper, or his press release, on this second inferance. He also has failed in his predictions of T since that time (a 3rd inference!-note the self- perpetuating style: inferance on inference on inference =a gross exageration, which the greens and some academics love), which were based on these 2 inferences in his 2005 paper. Doesn't say much for the value of the paper does it? As for Mclean et al 2009 and back to reality, he simply says that short term variability is driven by natural internal factors; as far as I can see, there is no '3 inferances strike and your out' here (unlike Hansen 2005).
    0 0
  18. Sorry about the repeated posts, I'm having PC issues, and the refresh is faulty.
    0 0
  19. 59, 61, 62. Chris and New York J Rather than arguing about Hansen looking properly at the solar acivity (which I don't beleive he did), I'm still not convinced that a theoretical long heat lag from the sun can't have caused the heating in both oceans and land from the 1950s-2000s, (iE I am not convinced of the various low calculated solar forcings). Here is another typical example. I had a look at 'tipping points' mentioned in the media from Australian scientists recently and the dire warnings from further warming. (ie warming creates more warming). But you could just as well apply this argument retrospectively. If the sun peaked in the ~1950s, tipping points from this heat could also hve been reached abou this tme, eg slow release of methane from arctic, less clouds over the decades as the air warms/warmed, especially over temperate zones, and so on. In other words, why can't late 20th century heating, be explained by tipping points which have ALREADY occurred from the peak in the sun, (which is using the alarmists OWN argument retrospecively-just to be consistent). I have never heard the argument of tipping points discussed retrospectively, but according to he alarmists, they should have already occurred from the heating from the sun to the mid 20th century. Why then do the alarmists use tipping points with greenhouse gases, but never the same as applied to the sun??? (I note that the changes in solar activity TSI etc do not seem to be enough, on their own, to cause the earth T to rise 1 C, but this is the whole issue of forcings and tipping points, so beloved by the AGWs). Also I am convinced of the medieval warm period, which means the sun's small changes must be significantly magnified by the climate etc).
    0 0
  20. Maybe here: http://bobtisdale.blogspot.com/2008/06/solar-signal-in-east-equatorial-pacific.html,is the explanation, that - "At some point you have to take the science and its evidence into account" dear Chris, ok; particularly: http://i26.tinypic.com/30iylfk.jpg. If now the red curve on this figure http://www.skepticalscience.com/images/tsi_vs_temp.gif by around move 40, 45 years, ahead... "most likely contribution from solar forcing a global warming is 7 +/- 1% for the 20th century and is negligible for warming since 1980" - And that's the whole truth? and so on ?
    0 0
  21. A rather more rigorous analysis of the contribution of generalised ocean circulation effects to 20th century temperature variation has just been published [***]: K.L. Swanson et al. (2009) Long term natural variability and 20th century climate change Proc. Natl. Acad. Sci. USA 106, 16120-16130 This analysis indicates that natural contributions (largely ocean circulation variability) have had a significant effect on 20th century temperature variability. However the nett contribution to overall 20th century warming is close to zero. Essentially ocean circulation variability made a positive contribution to early (1900-1940) 20th century warming, a negative contribution to mid 20th century warming and a positive contribution to late 20th century warming. Once the natural variability is removed the externally forced (greenhouse) contribution is manifest as a continuous accelerating warming. [***] http://www.pnas.org/content/early/2009/09/09/0908699106.abstract abstract: Global mean temperature at the Earth's surface responds both to externally imposed forcings, such as those arising from anthropogenic greenhouse gases, as well as to natural modes of variability internal to the climate system. Variability associated with these latter processes, generally referred to as natural long-term climate variability, arises primarily from changes in oceanic circulation. Here we present a technique that objectively identifies the component of inter-decadal global mean surface temperature attributable to natural long-term climate variability. Removal of that hidden variability from the actual observed global mean surface temperature record delineates the externally forced climate signal, which is monotonic, accelerating warming during the 20th century.
    0 0

Prev  1  2  

You need to be logged in to post a comment. Login via the left margin or if you're new, register here.


The Consensus Project Website

THE ESCALATOR

(free to republish)


© Copyright 2024 John Cook
Home | Translations | About Us | Privacy | Contact Us