Climate Science Glossary

Term Lookup

Enter a term in the search box to find its definition.

Settings

Use the controls in the far right panel to increase or decrease the number of terms automatically displayed (or to completely turn that feature off).

Term Lookup

Settings


All IPCC definitions taken from Climate Change 2007: The Physical Science Basis. Working Group I Contribution to the Fourth Assessment Report of the Intergovernmental Panel on Climate Change, Annex I, Glossary, pp. 941-954. Cambridge University Press.

Home Arguments Software Resources Comments The Consensus Project Translations About Support

Bluesky Facebook LinkedIn Mastodon MeWe

Twitter YouTube RSS Posts RSS Comments Email Subscribe


Climate's changed before
It's the sun
It's not bad
There is no consensus
It's cooling
Models are unreliable
Temp record is unreliable
Animals and plants can adapt
It hasn't warmed since 1998
Antarctica is gaining ice
View All Arguments...


Username
Password
New? Register here
Forgot your password?

Latest Posts

Archives

Pre-1940 Warming Causes and Logic

Posted on 21 March 2011 by dana1981

We've previously examined the mid-century cooling, but another common "skeptic" argument is that the early 20th Century warming proves that the current global warming could be natural.  Although there was a significant increase in global temperature in the early 20th Century, the rate of warming from 1910 to 1940 was lower than the rate of warming from 1975 to 2005, at about 1.3 vs. 1.8°C per century, respectively.  That being said, it's worth taking a look at what caused the early century warming.  Several different factors contributed.

Carbon Dioxide

Although humans were not burning very large amounts of fossil fuels or emitting large amounts of carbon dioxide (CO2) in the early 20th Century, relative to the late century, CO2 emissions were non-negligible and did play a role in the early century warming. 

From 1900 to 1940, atmospheric CO2 levels increased from approximately 295 to 310 parts per million by volume (ppmv).  The equilibrium temperature change caused by this increase in CO2 is the climate sensitivity (λ) multiplied by the radiative forcing, which is approximately 5.35 times the natural log of the change in CO2 (Myhre 1998):

The best estimate for the climate sensitivity parameter is 0.8 (Wm-2K-1).  Thus at equilibrium, this CO2 change would be expected to cause a 0.22°C increase in the average global surface air temperature.

Meehl et al. (2004) plots the estimated anthropogenic contribution to temperature change in Figure 1 below.  Most of the anthropogenic influence comes from CO2. 

meehl anthro

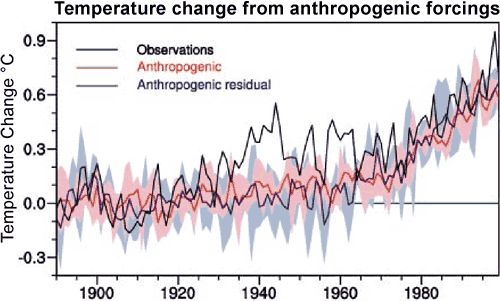
Figure 1: Climate model results from anthropogenic forcings compared to observations (black line). The red line is the average of the four-member ensemble. The pink shading is the model range. The blue line is the ensemble mean and the light blue shading is the ensemble range.

As you can see, the best estimate of the anthropogenic contribution to the 1910-1940 warming is approximately 0.1 to 0.15°C.  This is smaller than the value we calculated above because the planet is not immediately in equilibrium.   Much of the energy imbalance goes into the oceans, causing what's known as the "ocean lag" due to the thermal inertia of the oceans.  The same lag effect applies to natural forcings. 

Solar

The solar radiative forcing is the change in total solar irradiance (TSI) in Watts per square meter (Wm-2) divided by 4 to account for spherical geometry, and multiplied by 0.7 to account for planetary albedo (Meehl 2002).  The albedo factor is due to the fact that the planet reflects approximately 30% of the incoming solar radiation.  As with CO2, we calculate the equilibrium temperature change by multiplying the radiative forcing by the climate sensitivity parameter.

Wang, Lean, and Sheeley (2005) compared a flux transport model with geomagnetic activity and cosmogenic isotope records and to derive a reconstruction of TSI since 1713 (Figure 2).

wang tsi 05

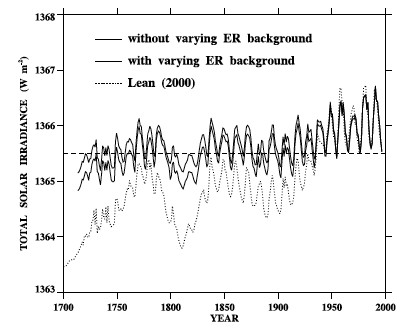
Figure 2: Total Solar Irradiance from 1713 to 1996 (Wang 2005)

As you can see, in the early 20th Century, from about 1900 to 1940 there was an increase in TSI from about 1365.5 to 1366 Wm-2, which we can plug into the formula above.  However, previous studies have estimated a TSI change as large as 2 Wm-2, so we'll estimate the change at 1 Wm-2.  We then only need the solar climate sensitivity parameter. 

The climate response to different radiative forcings is similar, but not identical.   This is known as the "efficacy" of a radiative forcing.  According to various studies of the direct solar forcing efficacy (from TSI alone), as summarized by the IPCC (Figure 3), it is likely smaller than the CO2 efficacy.

efficacies

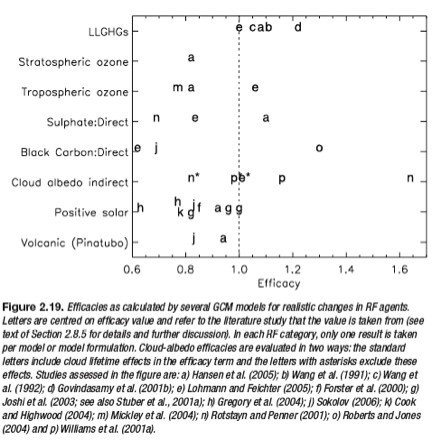
Figure 3: Efficacies of various radiative forcings as calculated in numerous different studies (IPCC 2007)

However, since there may be indirect solar effects not accounted for in the direct solar radiative forcing calculation, we'll conservatively estimate the solar climate sensitivity parameter as equal to the CO2 climate sensitivity of 0.8 (Wm-2K-1).  Thus at equilibrium, the solar change would be expected to cause a 0.15°C increase in the average global surface air temperature.  Simlar to the anthropogenic contribution, the best estimate of the solar contribution to the 1910-1940 warming in Meehl (2004) is approximately 0.1 to 0.15°C (Figure 4).

Meehl solar


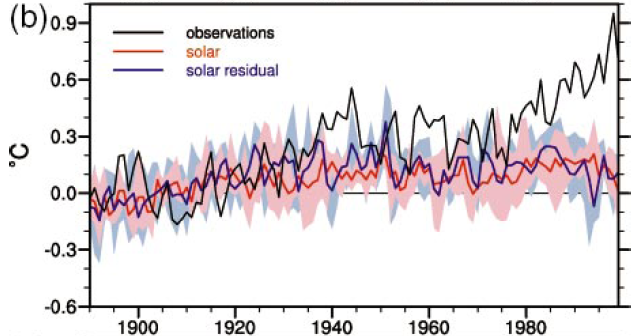
Figure 4: Climate model results from the solar forcing compared to observations (black line).

Other Forcings

CO2 and the Sun played the largest roles in the early century warming, but other factors played a part as well.  For example, human aerosol emissions caused a slight cooling, ozone and other greenhouse gases caused a slight warming, low volcanic activity resulted in a slight warming, and natural cycles like the Atlantic Multidecadal Oscillation (AMO) may have contributed to the warming as well (Tett et al 2002).  Meehl (2004) plots the net natural contribution to the warming in Figure 5.

meel natural

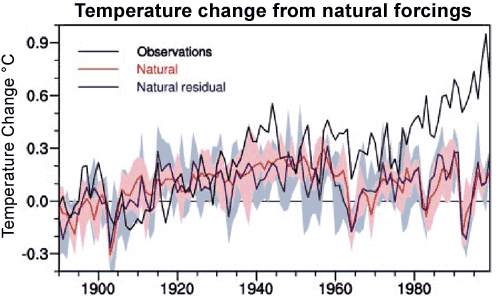
Figure 5: Climate model results from all natural forcings compared to observations (black line).

Conclusion

The "skeptic" logic behind this argument is usually that if the early 20th Century warming was as large as the late century warming, and was natural, then the current warming could be natural as well. 

Ultimately while natural forcings can account for much of the early 20th Century warming, humans played a role as well.  Additionally, the early century warming wasn't as large or rapid as the late century warming, to which these natural factors did not contribute in any significant amount.

But more importantly, we don't assume that the current warming is caused by humans because it's "unprecedented" or faster and larger than previous natural warming events.  We know the current warming is anthropogenic because that's what the physical evidence tells us.

NOTE: this post is also the Advanced rebuttal to "It warmed before 1940 when CO2 was low"

0 0

Printable Version  |  Link to this page

Comments

Prev  1  2  

Comments 51 to 73 out of 73:

  1. "at equilibrium, this CO2 change [from 1900 to 1940] would be expected to cause a 0.22°C increase in the average global surface air temperature."
    Due to the ocean lag and other anthropogenic effects, "the best estimate of the anthropogenic contribution to the 1910-1940 warming is approximately 0.1 to 0.15°C". By 1960 it's 0.15 to 0.2°C, or roughly half of the 0.3°C average surface warming. I'd call 50% significant.
    0 0
  2. 27 dana1981 I still don't get it. Surely the point of the article is that you have some how accounted for the warming in this period. Is that the point? My objections are that you haven't, there are so many fudge factor and unquantified 'others' that you can make your sum add up to whateve you want. Why choose 66% for the unrealised warming, it could just as well be 33% over a 30 year period? Did you factor in equilibration for solar, I don't see that? You seem unconcerned that solar forcing may be 3X too high compared with recent estimates. You throw in fudge factors such as ocean cycles without stating magnitudes. Solar may be 0.1oC but let's fudge that up to 0.15oC with indirect effect which in other contexts you would probably dismiss as speculative. Does it matter that 0.15+0.15 does not equal the warming for this period (which maybe 0.4oC or 0.45oC)? Anybody can make numbers add up to whatever they choose to when there is so much wiggle factor. Here's my version Warming for 1910-1940 is 0.45oC (HADCRUT) CO2 contribution is 0.07 (33% of .22, equilibration) Solar contribution is 0.03 (1/3 of 1W/M2 based on newer TSI estimates) 'Other' forcing must be what's left 0.35oC Conclusion - Ocean oscillations and 'others' play the major role in climate. I don't necessarily agree with that conclusion but give yourself enough wiggle room and you can make any conclusion you want.
    0 0
  3. Dana, In your 'Other forcing' section you give two references neither of which actually deal with the role of ocean oscillations from what I can see (Meehl and Tett .
    0 0
  4. Robert Way at 13:24 PM, I agree. The links provided in another post --"[DB] There is no robust evidence (AFAIK) showing that oceanic cycles affect the global land+sea temperatures, as Tamino thoroughly shows (here and here for starters)." were not very informative. The Tamino examination of the MEI only looked at 1975 onwards whilst the AMO examination went back to 1880. Firstly they should all address the same time frame, and secondly the matter cannot be properly understood or quantified by individual analysis of separate systems. The objective should be to examine the global response and so the systems from every ocean, every ocean, have to be examined in order for the nett response to be determined. It is very clear that all the systems oscillate differently, at times in concert, at other times offsetting and yet other times intensifying the effects of adjacent systems. The time spent in each phase varies as well as the magnitude, so trying to analyse just one system over less than one complete oscillation provides virtually nothing meaningful in a global sense. Has anyone produced a study that has tracked the nett total heat that is sunk or released to or from the oceans due to all such the cycles?
    0 0
  5. HR -
    "Surely the point of the article is that you have some how accounted for the warming in this period. Is that the point?"
    This post is a rebuttal to the "skeptic" myth that the pre-1940 warming was purely natural, and as large as the current warming, thus the current warming could also be natural. The article refuted all three of these points. 1) A significant portion (close to half) of the pre-1940 warming was anthropogenic. 2) The pre-1940 warming was smaller than the current warming. 3) We know the current warming is anthropogenic based on physics. Even if the first two "skeptic" points were true, it does not follow that the current warming is natural.
    0 0
  6. HR, Meehl et al suggests warming due to volcano is 0.2, which makes up a significant portion of the 'other' warming. Keep in mind that the error bar for the temperature is at least 0.1 of a degrees, the difference is not as big you suggest. Regarding ocean oscillations, ENSO seems to be resolved in both the papers.
    0 0
  7. 40 IanC There is this review which explains the background to different estimates of multi-centennial TSI variation (starting on page 11 if you don't want to read all 53 pages). It specifically states why the early Hoyt and Schatten estimates may simply be wrong based on false assumptions. It can't help with why the more recent estimates (1-2 W/M2 for MM to present) are different to the new Schrijver work, the review doesn't include the Schrijver work. The Schrijver explanation for the difference between the recent estimates and their work is described on page 4 of the PDF and is summarized in Fig3. I have to admit it get's too technical for me but the gist would seem to be thus. It would seem that TSI variation is affected by things that were visible (sunspots) and not visible (faculae??) to early observers. Modern scientist have to extrapolate back these non-visible features by modelling them. Without access to the conditions in 2008/2009 to constrain some of the parameters the use of SSN to estimate magnetic flux has introduced biases which are compounded the further one goes back in time. I think Schrijvers point is that the quiet conditions of 2008/2009 constrain some of the modelling parameters better and lead to lower estimates of TSI variation. But as I say this is all too technical for me so I could be wrong, I also have no way of judging the merit of the argument It seems highly disturbing that in your view the TSI variation can undergo maybe a ten-fold revision downward without having implications about our understanding of what drives climate. If that's the case it seems hardly worth deriving estimates in the first place, again this looks like far too much wiggle factor for this to be meaningful science. Maybe you can explain why ten-fold drops in TSI variation don't really matter? I know the line on this website is that if solar forcing is lowered then that just pushes up climate sensitivity. I see how that works with respect to the simple equation that describes the relationship between temperature change and forcing, but that's all. It's certainly not the only conclusion one could draw from that observation and can only be made by assuming a high degree of certainty about the science. The knock on effects of high climate sensitivity for other aspects of the science just seem to be ignored as well.
    0 0
  8. 56 IanC I guess Dana mentioning AMO in the same sentance as these papers was what I was getting at. I can't see where these papers deal with multidecadal cycles.
    0 0
  9. 55 dana1981 OK I was just thinking about what really matters, I guess we have different priorities. 1) Too much wiggle room to for this to be accurate. 2) I agree with you 3) The basic physics only tells us so much and I think is largely uncontested. It's how this is mediated by the the complex, chaotic system that differentiates trivial AGW from catastrophic AGW. The basic physics doesn't give us climate sensitivity and that seems to be what ultimately matters.
    0 0
  10. HR - I agree climate sensitivity is what matters. But that's not the issue here.
    0 0
  11. 57+58HR, Thank you for the link, but the first link is to the Schrijver et al paper, not the review you mentioned. I have no problem with the downward revision of short term TSI variability because it is small to begin with. The variation in TSI through a 11 year cycle is about 1W/m^2 (at least we can say this with some certainty), which translates to about 0.1 degrees of change, so I think whether the difference from MM to current is 1w/m^2 or 0.1 w/m^2 is essentially immaterial in the grand scheme of things, simply because 1w/m^2 is small compared to the error bars, not only for the temperature record but compared to the uncertainties in the other forcing factors. Putting it in perspective, the projected increase in temperature is anywhere from 2 to 4 degrees over the next century. How significant will 0.1 degrees change due to the revision be? The sun plays an important role in our climate when the orbital changes causes 1% to 10% change in the TSI, if the 10 fold correction happens here then yes there is a need to rethink the whole picture. regarding the AMO. I don't see it mentioned anywhere in the paper. Then again the gap between the observed and forcing account for is about 0.1 or 0.2 ignoring solar.
    0 0
  12. dana it seems that you distort somewhat the numbers. If the warming rate is 1.3°C /century during the 1910-1940 period, this makes a total 0.4 °C. Fig 1 shows that anthropogenic influence is estimated to be around 0.1 °C, and Fig 5 shows around 0.2 °C for natural forcings (BTW in Fig 4, I think the text should be corrected, it says " Simlar to the anthropogenic contribution, the best estimate of the anthropogenic contribution to the 1910-1940 warming in Meehl (2004) is approximately 0.1 to 0.15°C " - you meant probably solar forcings) for natural forcing. You don't plot the sum of the two, but I guess you have some difficulties to explain the whole variation. And there is absolutely nothing that explains naturally the break around 1940 - nothing changes up to the Agung explosion in 1963. So the whole picture looks much more like a approximate estimate of largely unknown contributions : "expected to be 0.22 °C but due to ocean lag and other anthropogenic effects it should be between 0.1 and 0.15 ° C" : well may be but that's very far from a precise theory ! why wouldn't ocean lags and other anthropogenic effects wouldn't limit rather the warming to 0.05 ° C , leaving 0.15 °C unexplained ? can you prove that it is impossible ? this is by no way an exclusion of the other possibilities , which is the real criterion of validity of a scientific theory. What you're offering here is a possible combination of influences, neither of them being precisely determined - and this combination doesn't fit very precisely the shape of the curve. You may find me too critical, that it is impossible that scientists would try to disguise the uncertainties and be dishonest. Then tell me, who said : "The Figure you sent is very deceptive. As an example, historical runs with PCM look as though they match observations -- but the match is a fluke. PCM has no indirect aerosol forcing and a low climate sensitivity -- compensating errors. In my (perhaps too harsh) view, there have been a number of dishonest presentations of model results by individual authors and by IPCC. " doesn't it prove that you can indeed reproduce data with wrong models ?
    0 0
  13. "This post is a rebuttal to the "skeptic" myth that the pre-1940 warming was purely natural, and as large as the current warming, thus the current warming could also be natural. The article refuted all three of these points." I think that what people like Humanityrules and myself try to tell you is that presenting a possible, unproved, combination of explanation is not a rebuttal and doesn't refute other possible combinations. Before excluding possibilities, you must have solid evidence to exclude them - which is not the case here.
    0 0
  14. Sorry Gilles, you can't deny physics. The CO2 warming during the period in question is in the 0.1 to 0.15°C range. The ocean lag is only so large - to claim that only 33% of the equilibrium warming is realized over the period in question is not physically plausible.
    0 0
  15. Interesting if complex discussion. It strikes me that looking at the NH (not global) reconstructions being posted, that there is a clear..ish 1000year cycle going on, with the peak of the lastest warm period at about 1900-1980, this is unlikely to be due to the changes in the sun's intensity as this it appears from the above this might have very little affect unless significantly amplified by another factor for which there is little to no definitive evidence. That leaves us ocean current changes for the warming from 1900-1940, plus the other factors listed in the blog post (human, low volcanoes, a little sun etc) which all tend to exaggerate the effect. After 1940's matters become complex as sulphur emissions rapidly rise to cause a cooling particularly in the NH, so natural variation is now altered by increasing CO2 and sulphur emissions, balancing each other to a degree and producing a period of limited variance and a mild cooling trend as would be in keeping with the 1000yr cycle. Also of course there is the longer cycle of precession causing a longer term cooling to the NH. So it seems that natural warming to MWP levels in the NH should have been expected for the 1800-190o. The worrying aspects are that the CO2 additions bit likley add some to pre-1940 warming, however since then for 30-40years, therefore until 1980 CO2 warming was masked by SO2 cooling, which means that the recent warming after 1980 is primarily the earth coming into equilibrium with with the CO2 rise until then, i.e. ~335ppm, we added another 60ppm in 30 years, and all that heating is about to realised, and keep in mind a significant amount of that warming is being masked by SO2 from India and CHina still. No wonder the CS from the past is so much higher, they didn't have any coal powered stations to mask it with SO2 for such a long period of time. CS is a difficult beast and has to be totally dependent on initial conditions (why CS to CO2 can be masked with a radiative blocker in the air, or reduced if there is less ice to melt!) and also prone to hystersis type changes as ice burdens rise and fall, snowball to greenhouse and full glacial to inter-glacial, from inter-glacial 100,000yr to inter-glacial 41,000yr, to NH ice free, to whole globe ice free. There is no way CS to a release of CO2 is the same during all these periods and why values for it vary from 1.5-12C or more. Where is CS now? Not sure but at present there potential of a large and rapid albedo accelerant the Arctic ocean, and warming this will not only affect the arctic it will influence weather patterns and ocean currents world wide. There is also the permafrost and the Greenland and WAIS ice sheets to consider meaning CS at present has a large very sudden albedo change potential and several large geologiclaly fast albedo changes to come, meaning CS under these initial conditions is very unlikely to be low, indeed if Pliocene records are right, then an equilibrium CS of 7.5-12-5C is very likely which 4.5C per 100years doubling is the lower limit of CS not the highest. So the warming episode of 1900-1940 seems natural yet amplified by CO2 to a small degree, then CO2 effects are masked until mid-1980's and then its take off to a new climatic paradigm for the earth, the choice that needs to be made is how to prevent that climatic shift coming from being too large for even informed planned adaptations to be effective?
    0 0
  16. Dana et al., Something else to keep in mind is that the peak in the early 1940s was/is probably too high-- that would reduce the amount of warming observed during the early part of the 20th century. I cannot recall the source, but the peak in global temperature anomalies in the early 40s is in part attributable to changes in the way sea-surface temperatures were measured during WWII. Specifically, British ships were not reporting SSTs (using the bucket method) during the war, while the US ships were, and they used temperatures derived from engine intake water which would have a slight warm bias. There is a citation for this, but I cannot track it down right now--looking after the Albie chicks.
    0 0
    Moderator Response: [DB] Try here (keep the chicks happy!).
  17. Good point, Albatross. Really we're quibbling over hundredths of a degree in these comments. The main points are that there was a significant anthropogenic contribution to the early century warming, which wasn't as rapid or large as the current warming, which is almost entirely anthropogenic.
    0 0
  18. @DB for my response at #3: Those two posts of Tamino are not proving anything about AMO. He is just declaring it cannot be any cause and that's it. And he is no expert in this issue and should not be kept as such. In his AMO post he actually does several gross mistakes, which he should be aware of considering his backgrounds. I've tried to reason with him in those two posts but he just keeps deleting my comments, like he is doing to many other commenters as well. For example, removing GISS from Kaplan is nothing but [self-snip]. GISS does not use Kaplan, but Reynolds SST which has a larger trend in North Atlantic. Picking 1975 as a starting year is cherry picking since it gives the strongest trend but then again he has no explanation for what has happened before that. Secondly, like in the graph you pasted here, you are only comparing vs giss and not Hadcrut, where the latter is propably a more reliable result. Since it has not been calculated and adjusted by the modelers and which is clearly shown in how multidecadal dynamics show up. You actually cannot compare giss vs anything.
    0 0
    Moderator Response:

    [DB] "You actually cannot compare giss vs anything."

    Well actually you kinda can (post here):

  19. Dana "Sorry Gilles, you can't deny physics. The CO2 warming during the period in question is in the 0.1 to 0.15°C range. The ocean lag is only so large - to claim that only 33% of the equilibrium warming is realized over the period in question is not physically plausible." Still don't understand. 50 % is physically plausible and 33 % is not ? there is only a 30 % difference between the two - do you know the climate relaxation time with a 30 % accuracy ? nice. What's the value then ?
    0 0
  20. Gilles #69 - I'm not sure where you get 50% from. The only time I referenced 50% was to say that roughly half of the early 20th century warming was from CO2. The Transient Climate Response is approximately 66% of the equilibrium climate response. That's why we've seen about 0.8 of the 1.4°C equilibrium warming from CO2 thus far. That's why approximately 0.1 to 0.15°C of the 1910 to 1940 warming was from CO2.
    0 0
  21. 61 IanC Ooops sorry about the links the solar/climate review is here and it's well worth reading, covering most of the interesting aspects of the science that come up on this website. I would look at the issue from the other direction. I think climate scientist like to understand what happened in the past because it gives them more certainty about the assumptions they are using to project future change. I'd argue that the lower TSI goes the less they are able to explain past change and the less the theory looks complete.
    0 0
  22. Dana, I took the 50 % figure from here "at equilibrium, this CO2 change [from 1900 to 1940] would be expected to cause a 0.22°C increase in the average global surface air temperature." Due to the ocean lag and other anthropogenic effects, "the best estimate of the anthropogenic contribution to the 1910-1940 warming is approximately 0.1 to 0.15°C". " for me 0.1 to 0.15 is roughly 50 % of 0.22. So 50 % is not excluded , but " that only 33% of the equilibrium warming is realized over the period in question is not physically plausible." To say that, you have to have an accuracy of a few 10 % on the relevant quantities - for instance on the equilibrium increase due to CO2, that you stated later to be "1.4°C equilibrium warming from CO2 thus far. " But here , we learn that climate sensitivity is only very broadly know with a factor 2 of 3 of uncertainty. So the whole discussion about "accuracy " and "inaccuracy" is very confused for me - I just see play with numbers with or w/o error bars following the need, sometimes it's accurate enough to exclude, sometimes not ... sorry but the real accuracy of your numbers is totally unclear.
    0 0
  23. Gilles #72 - if you had read my link, you would have seen
    "it is very unlikely that [transient climate response] is less than 1°C"
    This is a minimum transient climate sensitivity parameter of 0.27 Wm-2K-1. For an increase in CO2 from 280 to 310 ppm (pre-industrial to 1940), the minimum anthropogenic warming by 1940 is 0.15°C. Or if you just look at the increase from 1900 to 1940, the minimum warming is 0.07°C. So it depends whether you're considering the anthropogenic contribution to 1940 from pre-industrial, or from 1900. But there is a minimum transient response.
    0 0

Prev  1  2  

You need to be logged in to post a comment. Login via the left margin or if you're new, register here.


The Consensus Project Website

THE ESCALATOR

(free to republish)


© Copyright 2024 John Cook
Home | Translations | About Us | Privacy | Contact Us