


 Arguments


Lessons from Past Climate Predictions: IPCC AR4 (update)
Posted on 23 September 2011 by dana1981
Note: this is an update on the previous version of this post. Thanks to readers Lucia and Zeke for providing links to the IPCC AR4 model projection data in the comments, and Charlie A for raising the concern about the quality of the original graph digitization.
 In 2007, the IPCC published its Fourth Assessment Report (AR4). In the Working Group I (the physical basis) report, Chapter 8 was devoted to climate models and their evaluation. Section 8.2 discusses the advances in modeling between the Third Assessment Report (TAR) and AR4.
"Model improvements can...be grouped into three categories. First, the dynamical cores (advection, etc.) have been improved, and the horizontal and vertical resolutions of many models have been increased. Second, more processes have been incorporated into the models, in particular in the modelling of aerosols, and of land surface and sea ice processes. Third, the parametrizations of physical processes have been improved. For example, as discussed further in Section 8.2.7, most of the models no longer use flux adjustments (Manabe and Stouffer, 1988; Sausen et al., 1988) to reduce climate drift."
In the Frequently Asked Questions (FAQ 8.1), the AR4 discusses the reliability of models in projecting future climate changes. Among the reasons it cites that we can be confident in model projections is their ability to model past climate changes in a process known as "hindcasting".
"Models have been used to simulate ancient climates, such as the warm mid-Holocene of 6,000 years ago or the last glacial maximum of 21,000 years ago (see Chapter 6). They can reproduce many features (allowing for uncertainties in reconstructing past climates) such as the magnitude and broad-scale pattern of oceanic cooling during the last ice age. Models can also simulate many observed aspects of climate change over the instrumental record. One example is that the global temperature trend over the past century (shown in Figure 1) can be modelled with high skill when both human and natural factors that influence climate are included. Models also reproduce other observed changes, such as the faster increase in nighttime than in daytime temperatures, the larger degree of warming in the Arctic and the small, short-term global cooling (and subsequent recovery) which has followed major volcanic eruptions, such as that of Mt. Pinatubo in 1991 (see FAQ 8.1, Figure 1). Model global temperature projections made over the last two decades have also been in overall agreement with subsequent observations over that period (Chapter 1)."

Figure 1: Global mean near-surface temperatures over the 20th century from observations (black) and as obtained from 58 simulations produced by 14 different climate models driven by both natural and human-caused factors that influence climate (yellow). The mean of all these runs is also shown (thick red line). Temperature anomalies are shown relative to the 1901 to 1950 mean. Vertical grey lines indicate the timing of major volcanic eruptions.
Projections and their Accuracy
The IPCC AR4 used the IPCC Special Report on Emission Scenarios (SRES), which we examined in our previous discussion of the TAR. As we noted in that post, thus far we are on track with the SRES A2 emissions path. Chapter 10.3 of the AR4 discusses future model projected climate changes, as does a portion of the Summary for Policymakers. Figure 2 shows the projected change in global average surface temperature for the various SRES.

Figure 2: Solid lines are multi-model global averages of surface warming (relative to 1980–1999) for the scenarios A2, A1B, and B1, shown as continuations of the 20th century simulations. Shading denotes the ±1 standard deviation range of individual model annual averages. The orange line is for the experiment where concentrations were held constant at year 2000 values. The grey bars at right indicate the best estimate (solid line within each bar) and the likely range assessed for the six SRES marker scenarios.
Figure 3 compares the multi-model average for Scenario A2 (the red line in Figure 2) to the observed average global surface temperature from NASA GISS. In the previous version of this post, we digitized Figure 2 in order to create the model projection in Figure 3. However, given the small scale of Figure 2, this was not a very accurate approach. Thanks again to Zeke and lucia for pointing us to the model mean data file.
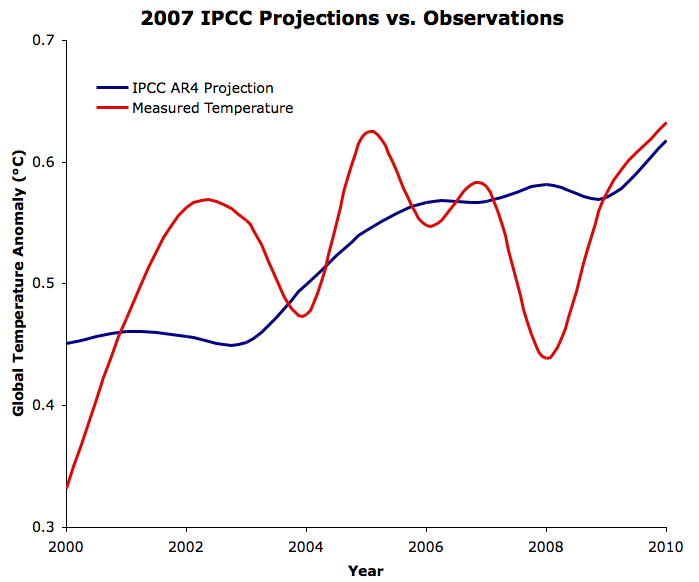
Figure 3: IPCC AR4 Scenario A2 model projections (blue) vs. GISTEMP (red) since 2000
The linear global warming trend since 2000 is 0.18°C per decade for the IPCC model mean, vs. 0.15°C per decade according to GISTEMP (through mid-2011). This data falls well within the model uncertainty range (shown in Figure 2, but not Figure 3), but the observed trend over the past decade is a bit lower than projected. This is likely mainly due to the increase in human aerosol emissions, which was not expected in the IPCC SRES, as well as other short-term cooling effects over the past decade (see our relevant discussion of Kaufmann 2011 in Why Wasn't The Hottest Decade Hotter?).
What Does This Tell Us?
The IPCC AR4 was only published a few years ago, and thus it's difficult to evaluate the accuracy of its projections at this point. We will have to wait another decade or so to determine whether the models in the AR4 projected the ensuing global warming as accurately as those in the FAR, SAR, and TAR.
Section 10.5.2 of the report discusses the sensitivity of climate models to increasing atmospheric CO2.
"Fitting normal distributions to the results, the 5 to 95% uncertainty range for equilibrium climate sensitivity from the AOGCMs is approximately 2.1°C to 4.4°C and that for TCR [transient climate response] is 1.2°C to 2.4°C (using the method of Räisänen, 2005b). The mean for climate sensitivity is 3.26°C and that for TCR is 1.76°C."
Thus the reasonable accuracy of the IPCC AR4 projections thus far suggests that it will add another piece to the long list of evidence that equilibrium climate sensitivity (including only fast feedbacks) is approximately 3°C for doubled CO2. However, it will similarly take at least another decade of data to accurately determine what these model projections tell us about real-world climate sensitivity.


 0
0  0
0


Comments