


 Arguments


The 97% v the 3% – just how much global warming are humans causing?
Posted on 15 September 2014 by dana1981
A pair of climate scientists recently had a dispute regarding how much global warming humans are responsible for. Gavin Schmidt from Nasa represented the consensus of 96–97% of climate experts in arguing that humans have been the dominant cause of global warming since 1950, while Judith Curry from Georgia Tech represented the opinions of 2–4% of climate experts that we could be responsible for less than half of that warming.
Curry is to be the featured speaker on this subject at a National Press Club event tomorrow hosted by the Marshall Institute; a right-wing thinktank that has spread misinformation about the dangers of smoking, ozone depletion, acid rain, DDT, and now climate change. She may also discuss the subject at an event next week hosted by the fossil fuel-funded right-wing think tank Texas Public Policy Foundation (TPPF).
The exchange between Schmidt and Curry can be read on RealClimate – a blog run by climate scientists. The discrepancy in both the quantity and quality of the supporting evidence used by each scientist was one of the most telling aspects of their debate.
For his part, Schmidt referenced the most recent IPCC report. The IPCC summarises the latest and greatest climate science research, so there is no better single source. The figure below from the IPCC report illustrates why 96–97% of climate science experts and peer-reviewed research agree that humans are the main cause of global warming.
The black bar indicates the amount of global surface warming observed from 1951 to 2010. The green bar shows the amount of warming caused by human greenhouse gas emissions during that time. The yellow is the influence from other human effects (mainly cooling from human sulfate aerosol emissions, which scatter sunlight), and the orange is the combined human effect. Below those are the contributions from external natural factors (mainly the sun and volcanoes) and from natural internal variability (mainly ocean cycles), while the whiskers show the uncertainty range for each.
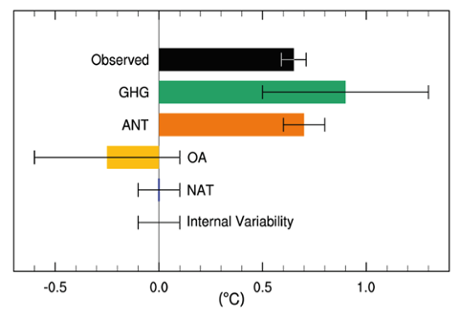 IPCC AR5 figure 10.5: Likely ranges (whiskers) and their mid-points (bars) for attributable warming trends over the 1951–2010 period due to greenhouse gases, other anthropogenic forcings (OA), natural forcings (NAT), combined anthropogenic forcings (ANT) and internal variability. The HadCRUT4 observations are shown in black.
Notice that the green and orange bars are both bigger than the black bar. This shows that greenhouse gases have caused more warming than has been observed over the past six decades, but some of that was offset by cooling from human aerosol pollution. And the best estimate from the body of peer-reviewed climate science research is that humans are responsible for more than 100% of the global surface warming since 1950, with natural factors probably offsetting a little bit of that with a slight cooling influence.
Schmidt illustrated this key point in the figure below, which is called a probability distribution of the warming caused by humans since 1950. The curve is centered at about 110% – the most likely value for the human contribution to global warming, while the probability of the human contribution being less than 50% is almost nil.
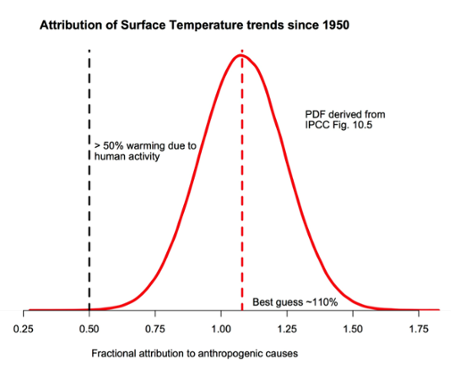 The probability density function for the fraction of warming attributable to human activity (derived from figure 10.5 in IPCC AR5). The bulk of the probability is far to the right of the ‘50%’ line, and the peak is around 110%. Source: RealClimate
Again it’s important to remember that the IPCC report is just a summary of the latest and greatest climate science research. The figures above are supported by the papers that have specifically investigated the attribution of recent global warming. This isn’t just one study; it’s based on many studies that are all in strong agreement. As the IPCC report concluded,
It is extremely likely that human activities caused more than half of the observed increase in GMST [global mean surface temperature] from 1951 to 2010.This assessment is supported by robust evidence from multiple studies using different methods.
It’s not just “more than half,” it’s also most likely close to 100%. In fact it’s just as likely that humans are responsible for about 160% of the global surface warming since 1950 as it is that we’re only responsible for 50%.
Curry disagrees with the expert consensus on this issue, but her arguments are rather muddled and “confused,” as Schmidt puts it. Her main argument is that there is uncertainty regarding the contribution of internal variability. The problem with that argument is that over long periods of time (like the six decades since 1950), positive and negative phases of ocean cycles tend to cancel each other out, and thus internal variability doesn’t have a large influence on long-term temperatures. As the first figure above shows, the IPCC estimates the temperature influence of internal variability since 1950 at ±0.1°C, during which time we’ve seen about 0.65°C global surface warming.
Curry also references a report written by Nic Lewis for the anti-climate policy think tank Global Warming Policy Foundation (GWPF), which I wrote about here. The GWPF report argues that the climate sensitivity is toward the lower end of the IPCC estimated range. However, the report is biased towards Lewis’ preferred approach, finding poor excuses to reject the many other methods that arrive at higher climate sensitivity estimates. Moreover, recent research has identified flaws in Lewis’ approach that explain why it incorrectly yields the lowest climate sensitivity estimates. In any case, even if the GWPF were correct, it wouldn’t disprove that most of the warming since 1950 is human-caused.
Curry’s other reference is to a single paper written by Zhou & Tung at the University of Washington in 2013, which concluded that roughly half of the global surface warming over the past 32 or 50 years could be explained by ocean cycles (specifically, the Atlantic Multi-decadal Oscillation). Matt Ridley also recently referenced this paper in an error-riddled Wall Street Journal editorial (debunked here and here and here and here). However, as Schmidt points out,
Tung and Zhou assumed that all multi-decadal variability was associated with the Atlantic Multi-decadal Oscillation (AMO) and did not assess whether anthropogenic forcings could project onto this variability. It is circular reasoning to then use this paper to conclude that all multi-decadal variability is associated with the AMO.


The ice at closer to the equators is much, much rarer, and incidentally only exists at extreme altitudes. Similar criticisms to regional differences apply really. However, in signal quality the arctic and antarctic cores provide much less noisy data. I honestly can't look at your 6-core data and say there was, or was not a Minoan, Roman, or MWP. It just is simply too noisy. Anyone making that claim (and the authors did not) would find it difficult to defend. Not believing in the above periods of warmth is certainly an opinion. I don't share it, and I am hardly alone. Maybe there wasn't. So the reason for the clear Greenland curves is?
We could discuss the Marcott paper all day long. But the simple fact is, it is based on very low resolution data. It is going to be significantly "smoother" by method. Useful to discuss on a centennial scale, maybe, but not decadal. Whereas ALL of the GISP2 data is high resolution. And Greenland temperatures correlate well enough today to global. To endorse the Marcott paper as telling us useful information on the LIA and MWP is not something I, and G. Schmidt it would seem, would do, for those reasons. And how is Gavin Schmidt's thoughts on using the Marcott paper for that reason "out of context"? I can't think of a way for it to be more in context.
Taking an average as was done is of limited scientific utility. The criticism of picking one proxy over another is a valid one. I mentioned that as an issue straight away. Here's why it isn't that useful. They vary too much to do that. Say I give two people a tape measure to go measure an object, and one comes back and says it's 2.25 metres, and the second says 4.60 metres. If I actually need to know, would I take the average and proceed? No. I would know that one, or both measurements is flat-out wrong. The same is the case with data like the multi-proxies. You know one or more "must" be wrong. So you dig in a little bit to try and figure out which. Or you throw the whole mess out and start over. The use of proxies like tree-rings and such and whether they are truly accurate enough is a point of contention. There is also the issue that they yield lower resolution data.
jwalsh @101:
Actually, with multiple proxies you do not know that any of them are wrong. What you know is that they are all regional proxies, and that regional temperatures differ from each other over time. You also know that the Global Mean Surface Temperature is the mean of all the regional temperatures across the globe.
So, the correct analogy is, suppose you send one person out to measure the height of a random individual in the city, and they tell you the height was 1.68 meters. Do you now know the average adult height? No. Suppose you send out eight people and they return with measured heights of 1.68, 1.82, 1.59, 1.76, 1.72, 1.64, 1.81, and 1.73. Do you now know that at least seven of them are wrong? Absolutely not. Do you now know that the average height is 1.719. No. But you do know that it is a much better estimate than the estimate from a single sample.
And if you take the mean of 73 samples (as with Marcott et al, without the bells and whistles), you know the result better still.
Jwalsh you are showing deference for this individual by refering to him as "Lord" Monckton, a title that he has produced abundant effort to attach to his fictitious belonging to the House of Lords. The institution had to specifically address his claim, as is shown in my link. As for reading anything from him, the answer is no, that would be a complete waste of time.
And I don't find that you have appropriately addressed Tom Curtis points at 92 and 99 above. Far from it. You're long on assertions and rethoric, rather short on substance and references. The way you use references is itself quite questionable on several occasions. I understand more than I care to why you think how you think. It doesn't make it any more convincing.
Jwalsh "But if you change how much warming is assessed by CO2, it follows that the relative attribution of the warming is altered."
I am not following this logic at all. If you want to change the attribution from anthropogenic factors, you have to show one of the other forcings is significant. The size of the forcings is an input to models from measurement not an output. The strength of the temperature response in the models is indeed a function of the climate sensitivity - the feedbacks - but that doesnt have anything to do with attribution. Perhaps you need to explain (and source) your comments about "downshifting estimates" and "setting temperatures"? (or was that merely rhetoric?)
The importance of OHC is that you cant attribute that increasing heat to a natural cycle - it has to be attributed to net forcings. It is not as noisy as surface temperature and so a good parameter to consider for attribution. Of course it isnt as relevant as surface temperature to us, but good for checking the basic science.
The zig-zagging that jwalsh continues to practice down this thread would be enough to provide an honest man with symptoms of psychiactric disorder. I am particularly impressed with his insistance that there is a significant 1200-year wobble in global climate. Thus @94 we are told:-
While I assume this "established scientific fact" extends only to a significant wobble and not to a wild wobble, I was of the understanding that such "established scientific fact" would comprise some considerable evidential basis. Yet such a basis remains absent. jwalsh instead presents here argument after argument defending his thesis by asserting that the evidence which dis-establishes any 1200-year wobble is not admissible.
Marcott et al (2013), the place were such a wobble would surely feature is dismissed with an in-thread comment from Gavin Schmidt (although the comment was actually to do with MWP/modern comparisons, thus not entirely of relevance to 1200-year wobble detection).
We are emphatically assured @86 that there is other evidence but it is never advanced.
Now, here's the thing. Both these quotes that together demonstrate a determined promotion by jwalsh of this alleged 1200-year wobble sit juxaposed to comment on Greenland ice core temperature reconstructions, things like Kobashi et al (2011) whose 4,000 temperature reconstruction from their Figure 1 is here. (Note the "Current Temperature Line" is the decadal temperature 2001-10. In a graph of the last 120-year reconstruction also within the full Figure 1, the paper puts the comparable annual temperature AD2010 at -27.3ºC.)
The reconstruction shows some pretty wild swings. But are there any wild 1200-year swings? Are there any significant 1200-year swings? Perhaps with his incomparable analytical skills jwalsh can help us out here, coz I see is a 4,000-year falling trend of 0.05ºC/century (which recent temperatures have already reversed within a single century) and a lot of wobbling but I do not see any wild or significant 1200-year wobble anywhere.
[RH] This thread is turning into jwalsh's personal gishgallop. Let's try to bring it back on topic and take any splinter arguments to the proper threads. Also, one should note the full image in the Kobiashi 2011 paper where that graph comes from.
The arguments about 'what the scientists in consensus XYZ really agreed to' exemplify a common denier mental block wherein they seem able to believe that each fact exists in isolation of all others.
That is... they concede that the Cook et al study found a 97% consensus for human greenhouse gas emissions having caused most of the observed global warming... but then argue that there is no consensus that continuing those emissions will be harmful. Which is just plain illogical.
If we accept that human greenhouse gas emissions have caused most of the observed warming to date then we know that future warming from continuation of the same factors will be harmful. It's like arguing, 'ok yes everyone agrees that smoking caused some people to die prematurely of cancer, but that doesn't mean that anyone agrees more smoking will lead to more cancer in the future'.
In short, they're treating intrinsically connected things as completely separate. That's a level of crazy even the tobacco apologists never reached.
CBDunkerson @106, while I agree that they are closely connected, and that in fact BAU will be harmful, possibly catastrophically so, the fact remains that the consensus supporting the later is about 10% less than that supporting the former based on Bray and von Storch's surveys (which are the only ones to test it, SFAIK). "Intrinsically connected" overstates their relationship, IMO, in part because what counts as harmfull is partly subjective, and also because the evidence of future impacts is not so strong as that for current attribution.
Tom, sure the level of consensus is slightly lower... but still very high and far far from the 'no consensus' view some 'skeptics' push.
Whether they are "intrinsically" or "closely" connected seems likely to be a largely semantic argument. Indeed, I'd actually describe 'closely connected' as suggesting a stronger link... 'intrinsically' just means that the connection between the two is 'inherent in their nature'. That is, most of the science underlying the two is the same, so anyone familiar with the facts behind one is also familiar with most of the facts behind the other... an intrinsic / natural connection.
CBDunkerson @108, as a purely technical point, I get uncomfortable calling percentages of agreement below 90% a "consensus". Calling the level of scientific agreement that AGW is likely very harmfull a "super majority", however, underplays the level of agreement considerably and gives a poorer idea of the level of agreement than calling it a "consensus".
More importantly, I did not raise a trivial point. It is important to recognize the difference between rational, and irrational disagreement. Scientists and economists, for example, can rationally disagree with the proposition that BAU over the coming century will likely result in harmfull global warming. That is, there can be rational disagreement with AGW as I have defined it.
I do not think, however, that anybody given current evidence can rationaly disagree with the proposition that BAU over the coming century has a significant risk of resulting in harmful global warming. Nor indeed, can we rationally disagree with the proposition that BAU over the coming century may not inevitably result in harmful global warming. From the IPCC assessments, the lower limit of the likely range for ECS combined with the lower limit of the likey range for risk assessments yields a scenario with minimum harm (and just possibly net beneficial) with a roughly 5% probability of occuring. (With equal probability, of course, we will have a near total disaster.) I do not consider those like Hansen who are on the upper end of those limits, and should not consider those like Tol (at least Tol a few years ago) on the lower edge.
In this respect, disagreement about how dangerous global warming will be is quite unlike disagreement about the probability of warming itself with BAU.
As to "intrinsic" and "closely", while your definition of "intrinsic" is correct, the fact is that judgements of harmfulness and the science of impacts goes well beyond the science of attribution, projections of forcings and determining TCR and ECS. The judgement of whether or not global warming will be harmful is no more intrinsic to the judgement that it will occur than the judgement that an explosive is harmful is intrinsic to the chemistry of the explosive reaction.