


 Arguments


Websites for Watching the Arctic Sea Ice Melt
Posted on 8 June 2011 by michael sweet
The Arctic Sea Ice collapse is one of the most obvious changes caused by Global Warming. Last winter's minimum was the third-lowest ever recorded. The rapid melt of the sea ice has led to scientific predictions of an ice-free Arctic Ocean in summer as early as 2013 (though most mainstream predictions range from 2030 to 2050). Every northern hemisphere summer, some bloggers watch the ice melt and try to guess what will happen. Others claim it is like watching paint dry. I think the situation is similar to watching a season of sport. The individual games are interesting to watch, and difficult to predict, but the final season record is what really matters. This article will give some web sites to check if you want to be informed about what is happening this season, but do not want to follow the day to day action. I posted a similar thread with links to more websites last year on Skeptical Science.
My favorite place to find out what is really happening in the Arctic is the National Snow and Ice Data Center (NSIDC) web site. This site has a sea ice extent graph that is updated daily.

It compares the ice to 2007 (the record low year) and also to the average from 1979 through 2000. The sea ice extent is defined as the area of ocean that is covered by at least 15% sea ice. In addition they have a very nice FAQ section that answers many sea ice questions. This FAQ section is a good place to find out the basics in one place that you can trust. NSIDC has a monthly commentary on the sea ice conditions. It is usually issued around the fifth of the month. This commentary discusses current sea ice conditions, relevant weather and whatever else the scientists at NSIDC think fits the situation. If you read only the NSIDC summary every month you will be well informed about the sea ice this summer. NSIDC also issues reports when something special happens, like if a new record low is set. These comments happen less often. Hopefully they will expand their commentary this summer.
Cryosphere Today is a good site to look at data. They offer no commentary on the data. They have a daily graph of the sea ice (from the University of Bremen) to follow the daily action.

They have a graph of the sea ice area from the past two years that gives you an idea of what has been happening for the entire melt season.

The sea ice area is defined as the total area of the ocean covered by ice. They take the sea ice extent and subtract the open ocean portions. There is a little more error in the sea ice area than the sea ice extent; that is why NSIDC and IJIS use the sea ice extent. In general, it is best to compare one site's graphs with their own graphs. Cryosphere Today has about 10 local area maps that are interesting.

They also have a comparison app that allows you to compare any two days of ice in the satellite record.

Notice above how much more ice there was in 1980. The snow data is only present for the past few years.
Cryosphere Today also has data from the Antarctic.
IJIS has a good site to check on the sea ice extent on a daily basis. Their graph is similar to the NSIDC graph, but they include all the years from 2002 to the present (they do not show the long term average). You can quickly compare the current extent to previous years.

Lately 2011 has been running near the record low.
If you check these sites occasionally and read Skeptical Science posts on sea ice during the summer, you will be able to keep up with what is going on. If you are interested in learning more about sea ice, Nevin’s Arctic Sea Ice Blog is a good place to read. Amateurs test their predictive powers against the ice. Nevin has a very complete daily graphs page which includes much more data than I have described here. If you want to watch the daily struggle of the ice against warming, this is the place to go. Nevin has links to all of the arctic web sites that I visit. Please attach links in the comments to other interesting sites.
If you want to keep up with the "skeptics", WUWT and Steve Goddard have a lot of commentaries on sea ice. Somehow they can look are a new record low and tell you the ice is recovering.
Any discussion of skeptics and sea ice would be incomplete without this graph from Denial Depot:

This graph is a little dated, but great skeptic data can be reused forever.
Have a good time following the Arctic Ice this summer.
Addendum
Regular Skeptical Science contributor Sphaerica has kindly made available the following graphics, which add clarity to the discussion:

Note that the areas of increased melt indicated by the yellow boxes are all at lower latitudes around the edges (warmer temps, warmer water).


 0
0  0
0 After (click to enlarge):

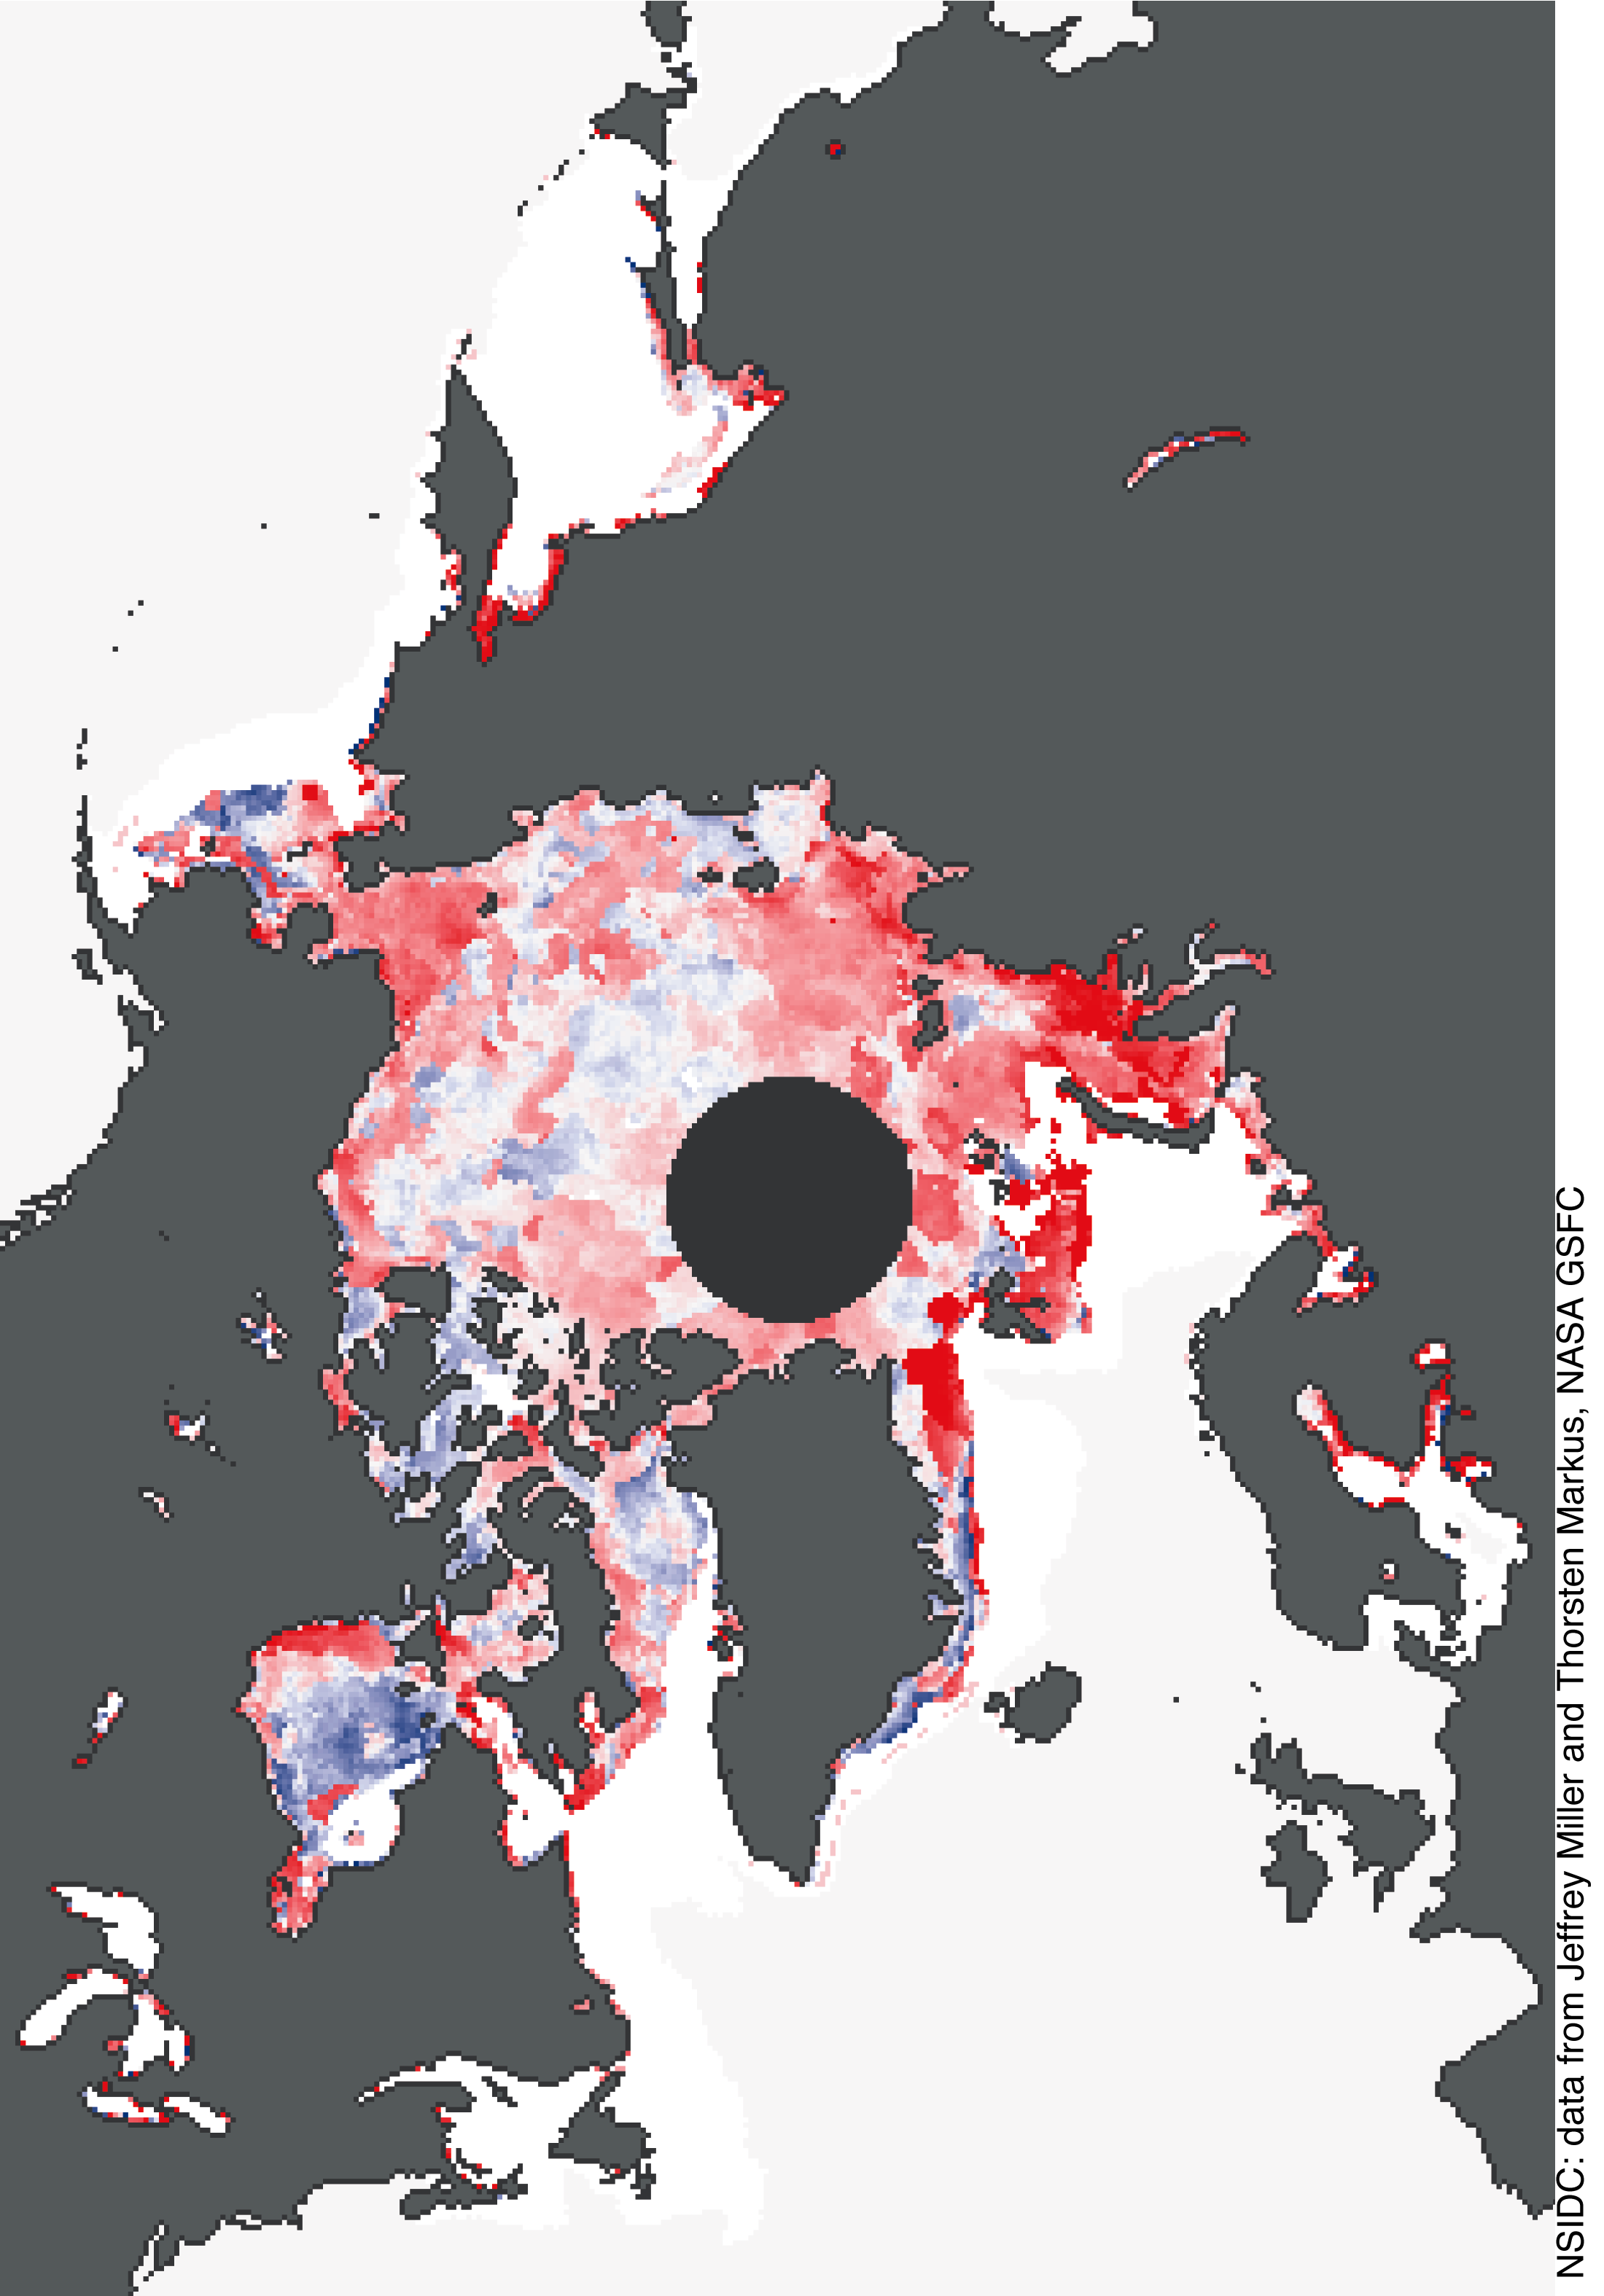 The darkest red is an anomaly of 50 days early or more.
An earlier start to the melt season no doubt means a longer melt season. Let's see how we can spin that into some form of 'no its not' denial.
The darkest red is an anomaly of 50 days early or more.
An earlier start to the melt season no doubt means a longer melt season. Let's see how we can spin that into some form of 'no its not' denial.


Comments