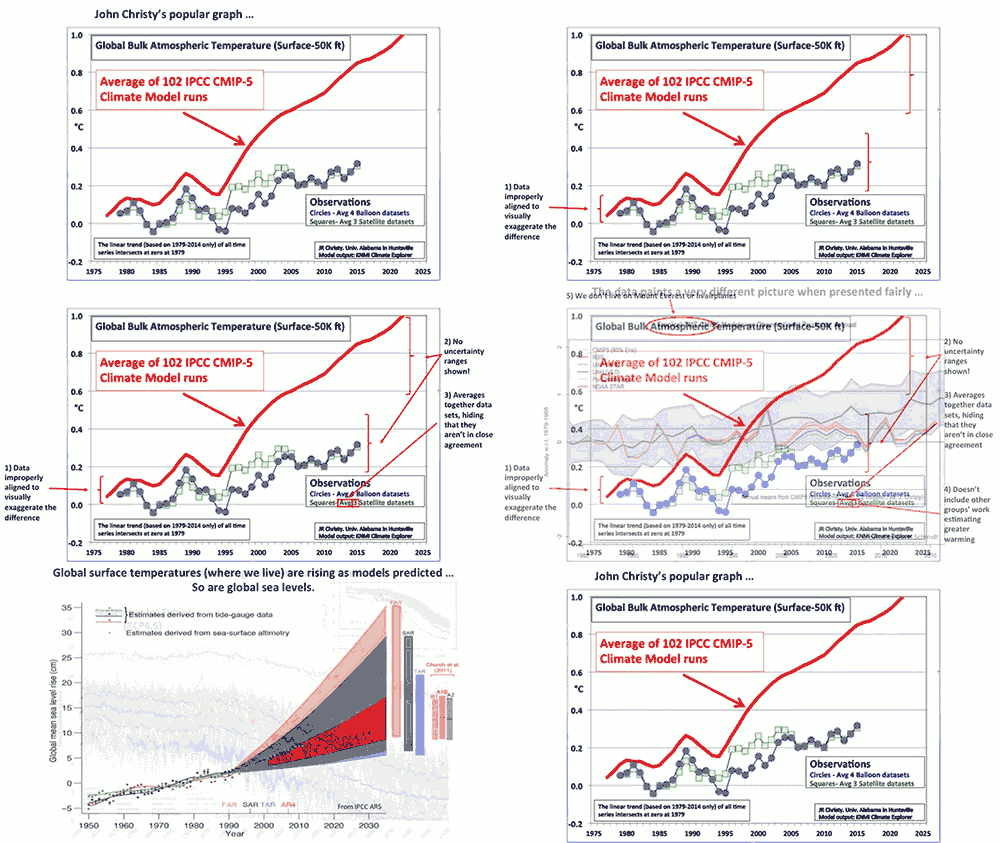

This animation shows the flaws in a chart frequently presented by John Christy in the media and Congressional testimony. The chart has not been published in a peer-reviewed journal. The frame showing the fully annotated chart is available here.
The final frames of the animation compare modeled and observed changes in global surface temperature (Mann et al. 2015), sea level rise (IPCC AR5), Arctic sea ice (Stroeve et al. 2012), and ocean heat content (Cheng et al. 2015).
 |
The Skeptical Science website by Skeptical Science is licensed under a Creative Commons Attribution 3.0 Unported License. |