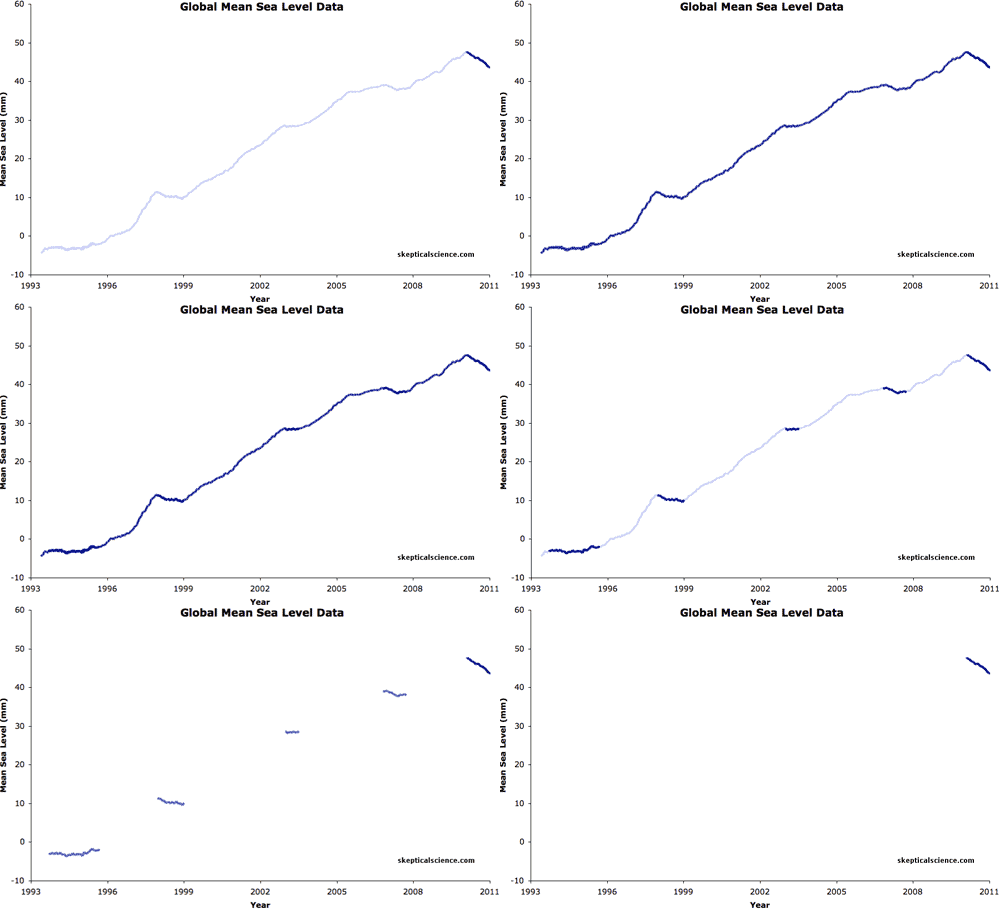

The first frame of this animation shows the change in global mean sea level since 1993 from satellite radar altimeter measurements (with a 12-month running average applied), available from the University of Colorado Sea Level Research Group. To illustrate the deceptive approach of "cherry picking" data in order to deny that sea level is rising, the second frame shows only the short periods when mean sea level was flat or declined, and the third frame shows the recent decline in 2010. Departures from a steady sea level rise as land ice continues to melt and as the ocean warms and expands arise primarily from the El Niño/La Niña Southern Oscillation (ENSO), where La Niña conditions produce precipitation that is concentrated over land rather than over ocean, leading to a temporary decrease in the global mean sea level.
 |
The Skeptical Science website by Skeptical Science is licensed under a Creative Commons Attribution 3.0 Unported License. |