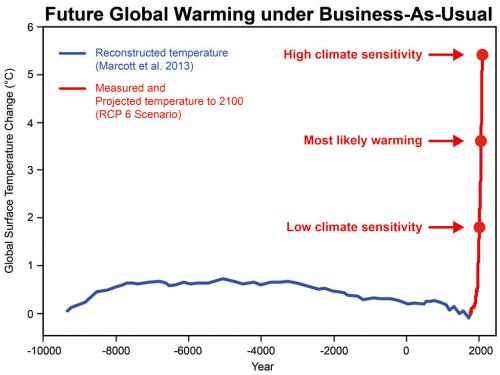
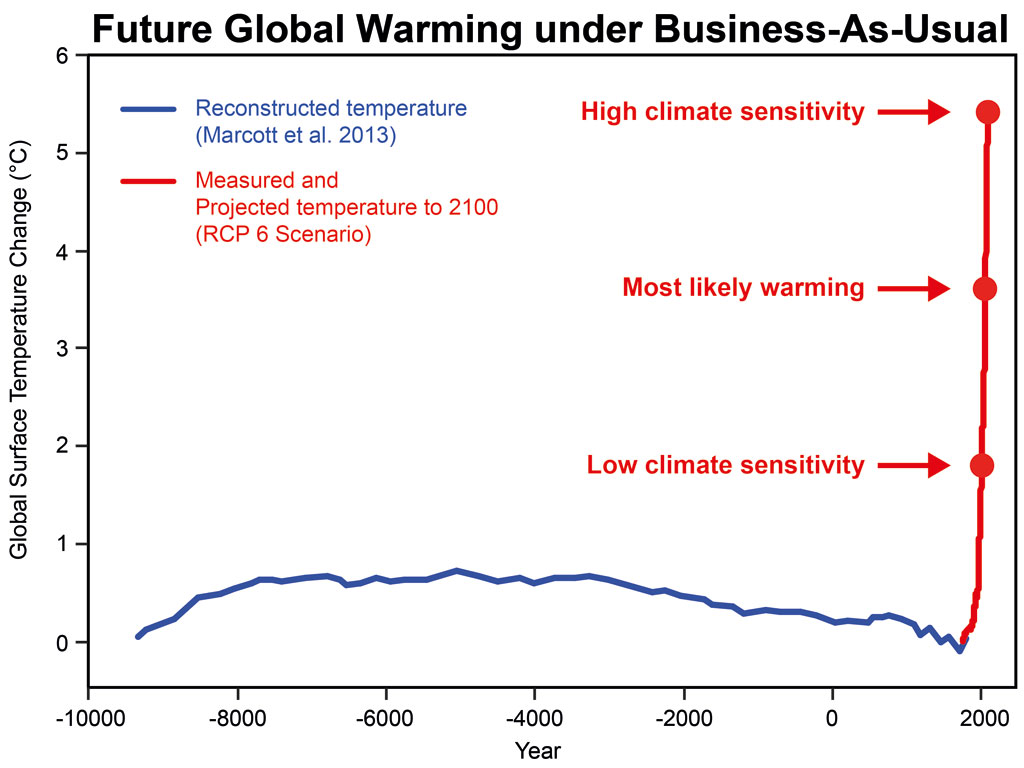
This graph shows that even at the lowest range of climate sensitivity, future global warming will take us well beyond any temperature experienced during civilised human history. The blue line represents reconstructed temperature (Marcott et al. 2013). The red line represents measured and projected global surface temperature (Meinshausen et al. 2011). The red dots show the projected warming in the year 2100 for three different climate sensitivities (high sensitivity 4.5°C, most likely sensitivity 3°C, low sensitivity 1.5°C). H/T to Joe Romm and Michael Tobis whose work inspired this graph.
For more info, see A Glimpse at Our Possible Future Climate, Best to Worst Case Scenarios.
 |
The Skeptical Science website by Skeptical Science is licensed under a Creative Commons Attribution 3.0 Unported License. |