Comments about a recent post on Meehl (2011), a climate model-based study, indicated that a number of issues had not been made very clear. For instance, what was meant by natural variability, and what were the mechanisms in the climate model which allowed heat to be distributed to the deep ocean? Hopefully I can clarify a few things with this additional post.
The natural variability referred to in the climate model is simply the exchange of heat in the surface and subsurface layers of the ocean, as is apparent in real world observations of La Niña and El Niño. La Niña-like patterns cause cooler-than-average surface temperatures because large areas of cool subsurface oceanic waters are brought to the surface.
And no, this isn't some new, as-yet-unexplained phenomena. The climate model suggests that La Niña and the (La Niña-like) negative phase of the Interdecadal Pacific Oscillation, well-observed ocean patterns, are when large amounts of heat are pumped down into the deep ocean.
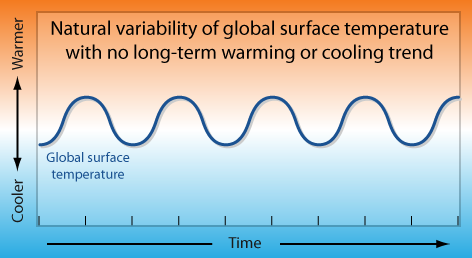
In a stable climate (i.e no human-caused global warming, or some other natural climate forcing) the 'peaks and valleys' of natural variability in global surface temperatures would average out to zero over the long-term. To get this point across, I've shown this in the graphic below in a very simplified manner - real-world natural variability, quite obviously, would be much more irregular.
Figure 1 - diagram illustrating "natural variability" with a long-term average of zero.
The ocean heat content of the real world, however, is steadily increasing, and this affects global surface temperatures. Therefore if we take that natural oscillation, with a long-term average of zero, and now plot it on a warming trend:
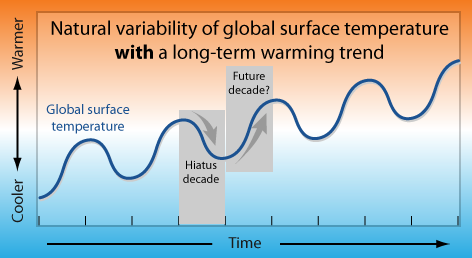
Figure 2 - diagram illustrating "natural variability" with a long-term warming trend.
We now see that the 'valleys' become shallower because they are superimposed on a climbing (warming) trend - these can be thought of as the hiatus decades. But note what happens to the peaks, they become steeper and higher, with each successive cycle climbing higher than the last.
The work of Meehl (2011) suggests that natural variability persists under conditions of global warming similar to the present, and that we may currently be in one of these decade-long hiatus periods. If so, we likely face a steep climb in global surface temperatures to the next peak of the natural cycle.
Being in contact with the atmosphere, and covering about 70% of the Earth's surface, the ocean surface layer is the main source of atmospheric heating. The ocean absorbs sunlight and warms during the day, but as it is warmer than the air above it, the oceans release this heat to the cooler atmosphere above. Because of this, the temperature of the ocean surface layers, and the ocean-atmosphere heat exchange, exert a strong influence on global surface temperatures.
These phrases simply describe the characteristic state of the climate over the period observed. During La Niña there is strong upwelling of deeper cooler water in the tropical Eastern Pacific. When enough of this cooler water reaches the surface it causes cooling of global surface temperatures, due to the ocean surface-atmosphere heat exchange and the increased rainfall over land it produces.
The opposing phase in this natural cycle, is El Niño. During El Niño, the upwelling of cooler deep water in the tropical Eastern Pacific shuts off, heat in the surface layers (top 100 metres of ocean) builds up, and the ocean loses heat to the atmosphere. This, and subsequent reduced rainfall over land, results in the rise in global surface temperatures we typically associate with El Niño. See Trenberth (2002). (There is a great animation of ENSO (La Niña/El Niño) here).
Therefore, if the dominant pattern over a decade is La Niña-like, then we would expect global surface temperatures to stagnate - the hiatus decades in the model. This is seen in the Pacific Ocean heat content trends from the climate model used by Meehl (2011) below:
Figure 3 - Composite decadal trends of zonal-mean temperature trends for hiatus periods for the Pacific Ocean. From Meehl (2011)
The vertical profile shows heat (the warm-coloured areas in figure 3) accumulating in the subsurface ocean during the hiatus periods. At the same time the ocean surface, particularly the top 100 metres, shows a cooling trend. It's this La Niña-like cooling trend in the surface layers which stalls global surface temperatures, even though the layers underneath are gaining heat.
The oceans warm during La Niña-like hiatus periods, but how does heat get into the deep ocean, when much of the surface ocean is cooler-than-normal? Figure 4 is from Meehl (2011) and shows the areas of ocean where heat begins to pile up.
Figure 4 - Composite average global surface temperature trends for hiatus decades; stipling indicates 5% statistical significance (i.e a 5% probability the result was due to chance or statistical error). Orange-coloured ocean areas represent regions where OHC is converging and being driven down into the deep.
In the warm-coloured oceanic regions, heat is converging in the surface layers, and is being forced down to the deep ocean. An example of this strong downwelling of heat in the model is shown, for the upper Pacific Ocean, in Figure 5 below:
Figure 5 - composite decadal trends of meridional overturning stream function (i.e. ocean volume transport) for the upper Pacific Ocean for hiatus periods. Arrows added for clarity. Sv= sverdrup. From Meehl (2011).
Again this is very reminiscent of the upwelling of cool water in the Eastern Pacific, and the pooling of warm water in the Northern Pacific that is observed during La Niña.
No doubt many readers will identify these hiatus periods, as depicted in figure 4, as similar not only to La Niña, but to the pattern that arises during the negative phase of the Interdecadal Pacific Oscillation. In other words, the climate model is simulating well-observed phenomena, although we currently lack the instruments and data to verify all the details.
So to recap:
Related SkS posts: Deep ocean warming solves the sea level puzzle, Billions of Blow Dryers: Some Missing Heat Returns to Haunt Us, Ocean Cooling Corrected, Again, Ocean Heat Content And The Importance Of The Deep Ocean and The Deep Ocean Warms When Global Surface Temperatures Stall
Posted by Rob Painting on Saturday, 15 October, 2011
 |
The Skeptical Science website by Skeptical Science is licensed under a Creative Commons Attribution 3.0 Unported License. |