2000 Years of Climate Reconstructed from Pollen
A window into climate change in North America over the past 2,000 years using pollen data
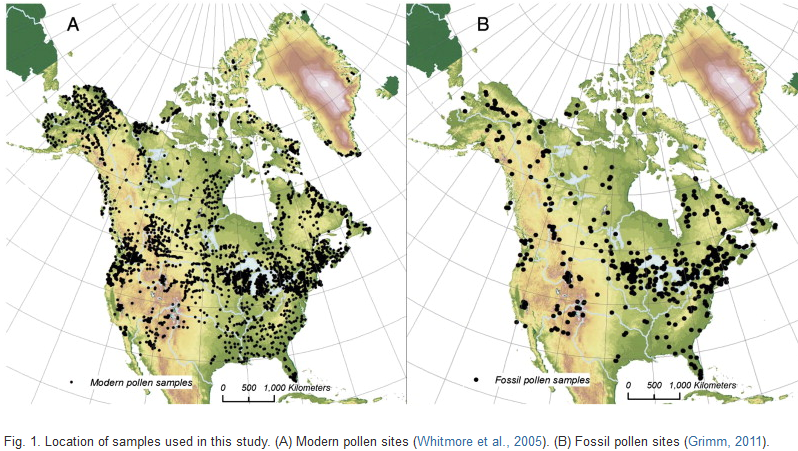
Researchers at the University of Ottawa Laboratory for Paleoclimatology and Climatology have reconstructed temperature for the for the last 2,000 years in North America using 748 pollen sites from the North American pollen database (NAPD), the Whitmore modern pollen dataset for calibration and the Modern Analog Technique (MAT). The Modern Analog Technique uses the modern distribution of pollen throughout a region and compares it to former distributions (usually collected from Lake Cores) to estimate changes in both temperature and precipitation (Figure 1). This technique allows for temperatures to be reconstructed for the warmest month of a calendar year across the many biomes of North America.
Pollen from lake sediment cores has proven to produce reliable climate reconstructions on centennial to millennial scales. A lake sediment core contains pollen grains from different taxa (anywhere from 15 to 135 taxa are used, this reconstruction used 63 taxa) and the deeper in the core, the further back in time the pollen was deposited. Certain vegetation assemblages and thus pollen represent specific climate conditions (temperature and moisture). The modern analogue technique (Overpeck, 1985) was used to find the modern site that most closely matches a fossil site in terms of pollen percentages down-core using the squared chored distance (SCD metric). In this manner the climate can be reconstructed through time.

Figure 1: Location of samples used in this study (A) Modern (B) Fossil
The researchers found that both the Medieval Warm Period (MWP) (800-1200 AD) and Little Ice Age (LIA) (1400-1850 AD) were both cooler than present (1961-1990 average) (Figure 2 - top and middle panels). The MWP was warmer than the LIA over much of the continent (Figure 2 – bottom panel). Hatched areas are regions where the reconstructions are more uncertain, due to sparse data.

Figure 2: Spatio-temporal comparison of distribution of reconstructed temperatures during the MWP, LIA and CWP
During the MWP, the atmospheric circulation changed such that the summer subtropical high pressure system over the North Atlantic was expanded. This is indicative of the positive phase of the North Atlantic Oscillation (NAO). There are interesting regional reconstructions from the eight eco-regions (adapted from Fedorova eco-regions) are shown in Figure 3. The uncertainties in the reconstructions are shown with dashed lines.

Figure 3: Reconstructed temperatures subdivided by vegetation classes
In summary, these reconstructions can be used to validate model simulations of past climate and lead to improvements in our ability to predict future climate. They also provide a window into past climate dynamics using low-resolution proxies.
This research was conducted by Andre Viau, Matthew Ladd and Konrad Gajewski at the University of Ottawa.
For more information please contact:
Laboratory for Paleoclimatology and Climatology
University of Ottawa, Department of Geography
Website: http://www.lpc.uottawa.ca
Phone: 613-562-5800 x 1327
Fax: 613-562-5145
Posted by robert way on Tuesday, 14 February, 2012


