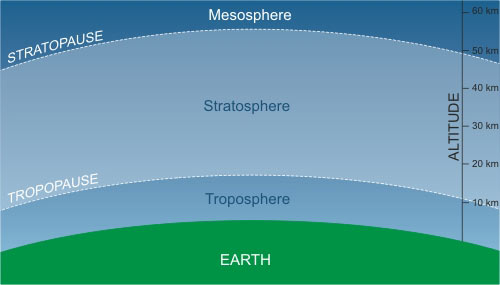
Figure 1: Atmospheric layers: Troposphere, Stratosphere and Mesosphere
There's been a number of queries regarding a new paper examining the role of stratospheric water vapor in global warming. The paper is Contributions of Stratospheric Water Vapor to Decadal Changes in the Rate of Global Warming (Solomon 2010). There are a few overly excited interpretations of the paper's results circulating around the blogosphere. This is presumably from readings of media clippings, not the actual paper. To accurately determine the significance of Solomon 2010, the best course is to see what the paper actually says.
The atmosphere is divided into several layers. The troposphere is the lowest part of the atmosphere. It contains most of the atmosphere's water vapor, predominantly supplied by evaporation from the ocean surface. Through the troposphere, temperature falls as altitude rises. The boundary between the troposphere and stratosphere is called the tropopause. This is known as the "cold point", the coldest point in the lower atmosphere. In the stratosphere, temperature actually rises with altitude. It warms as you get higher - the opposite of the troposphere.

Figure 1: Atmospheric layers: Troposphere, Stratosphere and Mesosphere
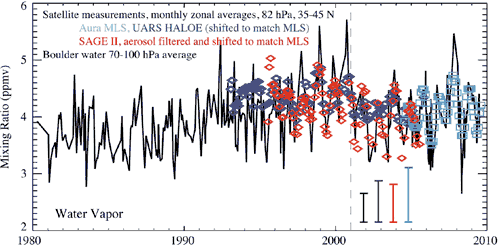
Solomon 2010 looks at the trend of water vapor in the stratosphere. Before 1993, the only observations of stratospheric water vapor were made by weather balloons above Boulder, Colorado (black line in Figure 2). They observed a slight increase from 1980. After 1993, several different satellites also took measurements (coloured circles, squares and diamonds in Figure 2). The various observations all found a significant drop in stratospheric water vapor around 2000. Most of the change in water vapor occurs in the lower stratosphere, just above the tropopause. The greatest changes also occur in the tropics and subtropics.

Figure 2: Observed changes in stratospheric water vapor. Black line: balloon measurements of water vapor, taken near Boulder Colorado. Blue diamonds: UARS HALOE satellite measurements. Red diamonds: SAGE II instruments. Turquoise squares: Aura MLS satellite measurements. Uncertainties given by colored bars (Solomon 2010).
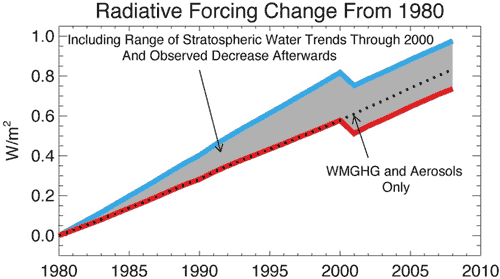
What effect would this have on climate? Figure 3 shows the change in radiative forcing imposed by changes in stratospheric water vapor. The dotted line is the radiative forcing without the effect of stratospheric water vapor changes. The grey shaded region shows the possible range of contribution from changing stratospheric water vapor. As it's a greenhouse gas, increasing water vapor has a warming effect. Consequently, the steady rise from 1980 to 2000 added some warming to the existing warming from greenhouse gases. The drop in water vapor after 2000 had a cooling effect.

Figure 3: Impact of changes in stratospheric water vapor on radiative forcing since 1980 due to well-mixed greenhouse gases (WMGHG), aerosols, and stratospheric water vapor. The shaded region shows the stratospheric water contribution (Solomon 2010).
What caused these changes? Water vapor in the stratosphere has two main sources. One is transport of water vapor from the troposphere which occurs mainly as air rises in the tropics. The other is the oxidation of methane which occurs mostly in the upper stratosphere. Most of the change in water vapor occurs in the lower stratosphere in the vicinity of regions affected by the El Nino Southern Oscillation. This seems to point towards convection and internal variability driving the changes. A comparison between stratospheric water vapor and tropical sea surface temperatures show good correlation which corroborates a link with El Nino. However, the correlation breaks down in some periods suggesting other processes may also be important. Consequently, the authors are cautious in coming to a firm conclusion on the cause.
There seem to be two major misconceptions arising from this paper. The first is that this paper demonstrates that water vapor is the major driver of global temperatures. In fact, what this paper shows is the effect from stratospheric water vapor contributes a fraction of the temperature change imposed from man-made greenhouse gases. While the stratospheric water vapor is not insignificant, it's hardly the dominant driver of climate being portrayed by some blogs.
The other misinterpretation is that this paper proves negative feedback that cancels out global warming. As we've just seen, the magnitude of the effect is small compared to the overall global warming trend. The paper doesn't draw any conclusions regarding cause, stating that it's not clear whether the water vapor changes are caused by a climate feedback or decadal variability (eg - linked to El Nino Southern Oscillation). The radiative forcing changes (Figure 3 above) indicate that the overall effect from stratospheric water vapor is that of warming. The cooling period consists of a stepwise drop around 2000 followed by a resumption of the warming effect. This seems to speak against the possibility of a negative feedback.
Posted by John Cook on Monday, 1 February, 2010
 |
The Skeptical Science website by Skeptical Science is licensed under a Creative Commons Attribution 3.0 Unported License. |