It is often said of the Arctic that, when it comes to climate change, this region of Earth is the proverbial 'Canary in the Coalmine' - that is, if anywhere is going to alert us that something's up, it's up there in the far north. So we have seen sea-ice coverage diminishing dramatically and sea-ice volume falling off a cliff. Land-ice too is on the retreat: a mineral exploration company that has returned to the Black Angel mine in western Greenland, last worked from 1973-1990, have found a new orebody exposed at surface, where "the existence of mineralisation at this location was known, but previously it was covered by 60m of ice." Just recently Skeptical Science reviewed the science and ran an interview with one of the lead scientists in a team investigating extensive outgassing of methane from the sea-bed of the East Siberian Arctic Shelf, possibly linked to the degradation of undersea permafrost. There's a lot going on up there, to which we can add the accumulating evidence that, paradoxically, reductions in sea-ice cover may be driving changes in atmospheric circulation patterns that have been behind the severely cold plunges and record-breaking snowfalls seen over the continents at more temperate latitudes in recent winters.
Living where I do, not far from the west coast of Wales, in that part of NW Europe that sticks furthest out into the Atlantic Ocean, cold winters are in general uncommon. The months of December, January and February are often dominated by zonal conditions in which Atlantic depressions are bowled at us one after another by a strong westerly jetstream. On occasion, high pressure builds on a N-S axis in the mid-Atlantic, allowing a northerly flow bringing snow-showers, but typically such events are over within a few days. In both 2009-10 and 2010-11, things were radically different. I well recall Christmas morning in 2010: it was symbolic of the whole affair in a month that had seen almost continuous snow and ice, and just when I thought it couldn't get any worse, I came downstairs to be greeted by a centimetre of solid ice on the tiled bathroom floor. I had left the taps a-dripping overnight, but what I hadn't accounted for was that ice built up outside, sealing the outflow-pipe so that back-pressure had forced an 'o'-ring joint apart where the pipe went through the wall, allowing the water to make its way across the floor until it got so cold that it, too, froze. The taps by that point had both stopped dripping as well. Not the most auspicious start to a day.

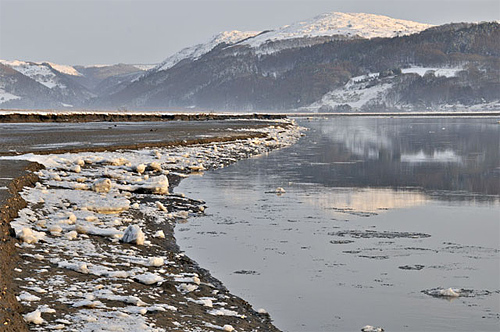
above: ice-floes along the Dyfi Estuary, Mid-Wales, December 2010. Photo: Author
I've included that tale of woe for the simple reason that it was an unprecedented event in my time in this part of the world (1981-present day) and locals reckoned that nothing like it had been seen since the Great Winter of 1962-63. Temperatures were plummeting to -15C or colder at night and deep snow stayed put for very many days. Not only that, it was the second winter in a row that had seen severe cold. Moreover, the tabloids gleefully ran headlines with various phrases, all sarcastic and including the words 'Global' and 'Warming'. It is intriguing, then, that there is a building body of evidence that changes up in the Arctic as a consequence of warming may well be driving this severe winter weather.
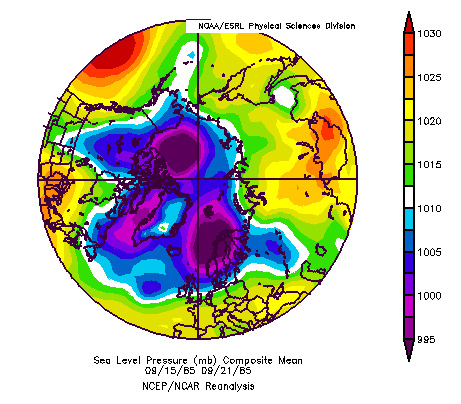
Regional-scale fluctuations in weather are influenced by a number of factors: thus we have El Nino and La Nina in the Tropical Pacific, with their sometimes major impacts on rainfall – or lack of it. In the North Atlantic, strong controls are exerted by the steepness of the pressure-gradient between the quasi-permanent Azores High and the Icelandic Low and by their positions relative to one another. If the gradient between them is strong – as would be the case with intense high pressure over the Azores and deep low pressure over Iceland, a strong west-to-east airflow results, bringing mild, wet and often windy conditions to NW Europe. This weather-pattern represents the North Atlantic Oscillation (NAO) in its positive phase. Conversely, the weaker the pressure-gradient between the Azores High and the Icelandic Low, the more negative the NAO becomes. This results in strongly reduced zonality, to the point that instead a meridional pattern develops – where the jetstream is relatively weak and weather-systems meander longitudinally past slow-moving anticyclones, known as blocking highs, for days or even weeks at a time. These blocks can bring much colder weather down to temperate latitudes in areas situated downstream.

above: typical pressure-pattern when the North Atlantic Oscillation is in its positive phase, with westerlies flowing in a circumpolar manner
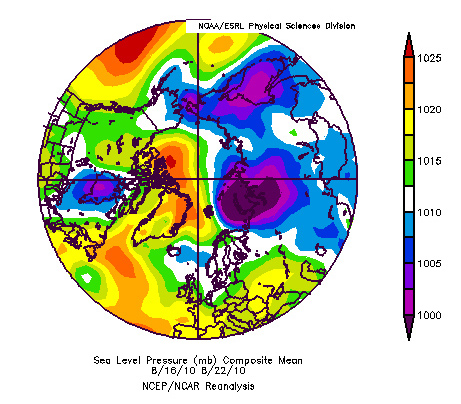
In the later part of the last decade, it was increasingly being recognised that changes were afoot in Arctic circulation patterns: specifically, the NAO and the related Arctic Oscillation (AO), both of which featured air flowing in an overall circumpolar pattern, either zonally or meridionally, had begun to alternate with a new pattern. This, variously termed the Arctic Rapid change Pattern or the Arctic Dipole pattern (Wu & Walsh, 2006), features anomalous high pressure situated on the North American side of the Arctic and anomalous low pressure situated on the Eurasian side. As a consequence, a new connectivity was at times established between polar and temperate regions, with two effects: firstly, heat was being transported into the Arctic from the south via the Bering Strait - the Dipole pattern occurred throughout the summer of 2007's record-breaking sea-ice melt season, but secondly, much colder air was also able to periodically escape from the Arctic southwards, a factor that could have major relevance during the winter months (Honda et al, 2008).

above: the Arctic Dipole pressure-pattern in August 2010. Note high pressure (red) over N Canada and low pressure (purple) over N Russia.
In terms of sea-ice melt, this pressure-pattern is a positive feedback: as ice extent dwindles, more open water is available to incident UV radiation and therefore warms: in turn this impedes the autumnal refreeze. In addition, the open water causes warming and increased water-vapour loading of the air above, which has increased average September - November tropospheric temperatures in the Arctic to 1°C or more above normal; surface temperatures have increased by around 3C. In turn, the warmer airmass has brought changes to the circulation-patterns that have brought more heat into the Arctic, exascerbating ice-melt. Perhaps this is an important factor in explaining why Arctic sea-ice melt has in recent seasons exceeded the model projections cited in the IPCC AR4. Models can just as much underestimate an effect if an hitherto unknown factor crops up!
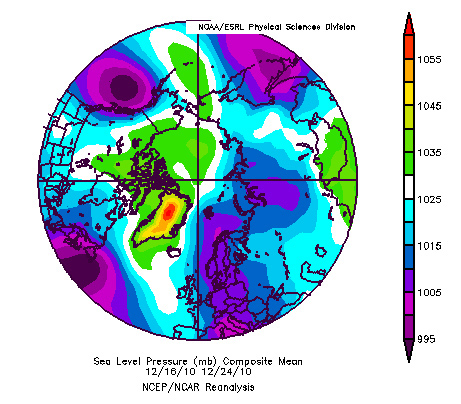
The winters of 2009-2010 and 2010-11 showed how the connectivity between the Arctic and temperate regions could plunge the latter into chaos. February 2010 saw Nor-easters dragging in moisture from the warm seas of the west Atlantic and colliding it head-on with Arctic air coming down via Canada - the result being some exceptional dumpings of snow across the NE United States. November 28th 2010 saw a Welsh record-breaking (for the month) overnight low minimum of -18C not far from where I live in Wales. On the very same morning, the temperature on the warm side of the block, at Kangerlussuaq in Arctic western Greenland, was +9C, or 27C warmer. That's extreme meridionality for you!
This change in wind directions to phases of extreme meridionality that permits teleconnection between the Arctic and the temperate latitudes has been christened the Warm Arctic-Cold Continents climate pattern. It commenced some time ago: as Overland and Wang (2010) note, "a persistent positive Arctic Oscillation pattern in late autumn (OND) during 1988–1994 and in winter (JFM) during 1989–1997 shifted to more interannual variability in the following years. An anomalous meridional wind pattern with high SLP on the North American side of the Arctic [the Arctic Dipole pattern], shifted from primarily small interannual variability to a persistent phase during spring (AMJ) beginning in 1997 (except for 2006) and extending to summer (JAS) beginning in 2005."

above: late December 2010 saw extreme meridionality with Polar air surging deep into NW Europe - compare with the positive NAO illustration above!
This brings us to the recent paper by Liu et al that has been in the news. In a nutshell their work involved examining observational data for winter (DJF) in the extratropical Northern Hemisphere and comparing it using numerical methods with the variations in Autumn sea-ice extent. They found changes in winter atmospheric circulation that resembled the negative phase of the AO - except that the meridional meanders that occurred took a different form and a different year-to-year variability than shown by the classic AO, with more frequent blocking patterns and greater snowfall, a factor with respect to the latter being an enhanced air-moisture content. Thus, they suggested, the ongoing reduction in sea-ice is playing a critical role in recent cold and snowy winters. They found that the most pronounced increase in blocking-related cold Arctic surges was over the eastern and midwestern USA and from NW Europe east and southeast to central China, with, as mentioned above, a rather persistent warm anomaly over NE Canada and Western Greenland, affected by warm air advection up from the Atlantic.
To quote Liu et al, "while natural chaotic variability remains a component of midlatitude atmospheric variability, recent loss of Arctic sea ice, with its signature on midlatitude atmospheric circulation, may load the dice in favour of snowier conditions in large parts of northern midlatitudes". This does not, of course, mean that just one factor will from now on control our winters: ENSO, the AO and the NAO will all continue to play their roles and at the time of writing conditions here are mild and the NAO has been running in positive mode for some time, keeping NW Europe mild with double-figure daytime maxima widespread.
So, to conclude: the Arctic has become an area of substantial positive temperature anomalies: this has been directly observed. The sea-ice anomalies and lower atmosphere heating over open Arctic water in Autumn have been directly observed. The relatively new Arctic pressure and atmospheric circulation patterns have been directly observed. Papers have been published citing lines of evidence for these features to a) be connected and b) have a potential effect on the climate further afield, including an increased severity of temperate-latitude winters. Although climate trends are multidecadal affairs and the research discussed above is relatively recent, the influence of open sea water in the Arctic, where at one time there was extensive sea-ice, is clearly one to watch in the coming years. This may not be the black-or-white conclusion that policymakers seem to expect these days, but that's how the world works: they might like to stop and reflect that the decisions that led to the Allies' victory in World War 2 were not made in the light of absolute certainty of outcomes.
Wu, B., J. Wang, and J. E. Walsh, 2006: Dipole anomaly in the winter Arctic atmosphere and its association with sea ice motion. Journal of Climate, 19, 210–225. [abstract]
Honda, M., J. Inoue, and S. Yamane, 2009. Influence of low Arctic sea-ice minima on anomalously cold Eurasian winters, Geophysical Research Letters, 36, L08707, doi:10.1029/2008GL037079. [abstract]
Overland, J.E., and M. Wang (2010): Large-scale atmospheric circulation changes associated with the recent loss of Arctic sea ice. Tellus, 62A, 1–9. [abstract]
Liu, J., Curry, J.A., Wang, H., Song, M. and Horton, R.M (2012): Impact of declining Arctic sea-ice on winter snowfall. PNAS 2012 ; published ahead of print February 27, 2012, doi:10.1073/pnas.1118734109 [abstract]
Posted by John Mason on Wednesday, 14 March, 2012
 |
The Skeptical Science website by Skeptical Science is licensed under a Creative Commons Attribution 3.0 Unported License. |