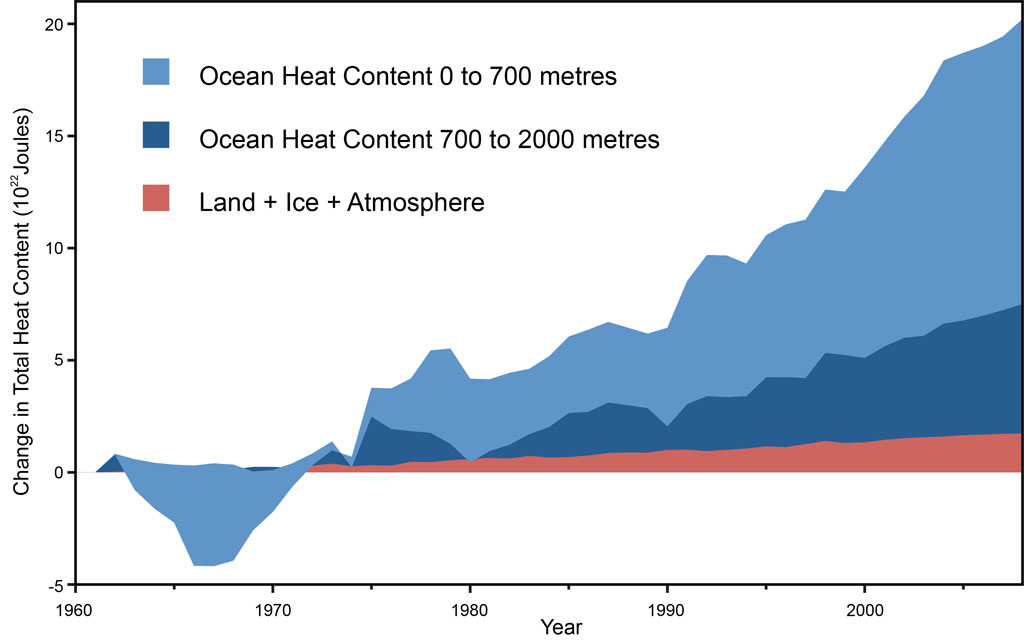
To put it as simply as possible, this is global warming:

Figure 1: Land, atmosphere, and ice heating (red), 0-700 meter OHC increase (light blue), 700-2,000 meter OHC increase (dark blue). From Nuccitelli et al. (2012).
This figure shows the amount of heat the Earth has accumulated since 1960, most of which has gone into the oceans. The amount of energy accumulating in the oceans over this timeframe is the equivalent of more than two Hiroshima "Little Boy" atomic bomb detonations per second, every second, since 1960. And this global warming shows no signs of slowing.
However, the myth that global warming has magically stopped is a pervasive one, most recently repeated during a rather silly and disruptive stunt in the middle of an important international climate negotiation.
Christopher Monckton impersonated a delegate from Myanmar at the 2012 United Nations Framework Convention on Climate Change international meeting in Doha, Qatar. He sat in the Myanmar delegate's seat, was mistakenly called upon to speak, and recited two common pieces of misinformation — that the planet has not warmed over the past 16 years, and that mitigating global warming by reducing human greenhouse gas emissions is more expensive than adapting to the consequences of climate change. Neither point is even remotely true.
Monckton later elaborated on his points in a blog post on one of the many climate contrarian blogs praising his dishonest and disruptive antics, attempting to justify the 'no warming in 16 years' myth by claiming:
"There has been no warming – or, to be mathematically nerdy, there has been no statistically-significant warming."
Being "nerdy" usually means getting the technical details correct; instead, Monckton has gotten the technical details very, very wrong here. A simple example illustrates why.
Let's say there has been an observed warming trend of 1 degree with an uncertainty of 2 degrees, or in math terminology, 1 ± 2 degrees. In this example, the warming trend is not statistically significant (the uncertainty is larger than the trend). Quite obviously, this does not mean the temperature trend is zero; rather, this means the most likely value is 1, and the possible values range from -1 to +3 degrees.
We cannot say for certain that the temperature trend is positive in this example, but that is most likely the case, and it would be very wrong to claim with any certainty that the true trend is zero. But that is exactly the mistake that Monckton has made here by claiming "there has been no warming". That is simply wrong, as any math nerd will tell you.
Similarly, the measured global surface warming trend over the past 16 years is approximately 0.09 ± 0.13°C per decade according to NASA, as anyone can check for themselves by using the Skeptical Science Temperature Trend Calculator. The surface warming is not statistically significant — again, the uncertainty is larger than the trend, and possible values range from -0.04 to +0.22°C per decade. However, the most likely value is still a positive one, meaning the Earth's surface has most likely warmed 0.09°C per decade, or 0.14°C total for the period of late 1996 thorugh late 2012.
Zero warming is one possibility within the range of uncertainty, but it would take a different statistical test to show that there has been no surface warming over the past 16 years, and that test would fail.
The Earth isn't flat; it's more than just a surface, and global warming is not accurately represented just by looking at surface temperatures. As climate contrarian scientist Roger Pielke Sr. correctly noted,
"The use of a global annual average surface temperature is an inadequate metric to quantify global warming and cooling."
In fact, over 90% of global warming goes into heating the Earth's oceans (Figure 2).
Figure 2: Components of global warming for the period 1993 to 2003 calculated from IPCC AR4 5.2.2.3.
This is why Pielke Sr. also argued that global warming "is best diagnosed by changes in upper ocean heat content". We don't quite agree — we believe that global warming is best diagnosed by considering all warming measurements including both surface warming and ocean heat content, as shown in Figure 1 above. Nevertheless, Pielke Sr. is correct to note that ocean heat content is a critical measure of global warming, as Figure 2 shows. Perhaps he should have a talk with Monckton to correct this Flat Earth thinking.
There is also a fundamental physical reason why we know global warming has not magically stopped: there is a global heat imbalance due to the increased greenhouse effect, and that heat has to go somewhere. In fact, a fellow going by the name of Christopher Monckton previously conceded this physical reality:
"Is there a greenhouse effect? Concedo. Does it warm the Earth? Concedo. Is carbon dioxide a greenhouse gas? Concedo. If carbon dioxide be added to the atmosphere, will warming result? Concedo."
Perhaps that Monckton should have a word with this Monckton, who is denying the physical reality that global warming has resulted from the increased greenhouse effect.
Finally, we must briefly address Monckton's second myth, that adapting to the consequences of climate change will be cheaper than mitigation by reducing greenhouse gas emissions. This is an assertion Monckton has been making for a very long time, which we have debunked many times, for example here and here and here. The sole peer-reviewed economics study which Monckton has referenced to support his argument was published by Richard Tol in 2009. Tol is one of the most conservative economists when it comes to estimating future economic damage from climate change. Nevertheless, this is what Tol said in the paper Monckton cited (emphasis added):
"A government that uses the same 3 percent discount rate for climate change as for other decisions should levy a carbon tax of $25 per metric ton of carbon (modal value) to $50/tC (mean value). A higher tax can be justified by an appeal to the high level of risk, especially of very negative outcomes, not captured in the standard estimates"
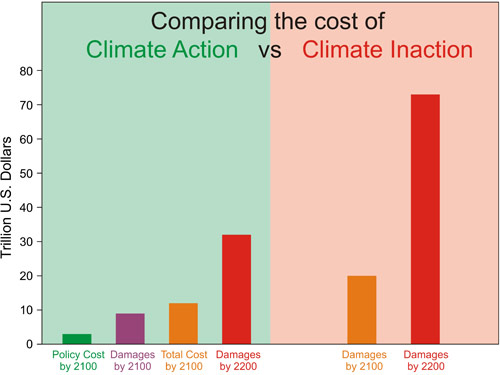
Thus even the most conservative economists like Richard Tol and William Nordhaus support mitigating climate change by putting a price on greenhouse gas emissions, quite contrary to Monckton's argument. This is because trying to adapt to the consequences of climate change will be trillions of dollars more expensive than avoiding global warming by reducing greenhouse gas emissions (Figure 3). There is simply no credible evidence to the contrary, and yet Monckton continues to repeat this myth over and over again.

Figure 3: Approximate costs of climate action (green) and inaction (red) in 2100 and 2200. Sources: German Institute for Economic Research and Watkiss et al. 2005
There are two lessons to be learned here. The first is that anybody who claims 'global warming has stopped' does not understand basic math and may be a member of the Flat Earth Society, because they seem to believe that the Earth's surface is an accurate representation of the planet as a whole. In reality, most global warming goes into the oceans, and ignoring the two Hiroshima atomic bomb detonations per second equivalent of ocean heat accumulation over the past half century is quite a large oversight.
The second is that anybody who claims adapting to climate change will be cheaper than preventing it is in denial of the body of climate economics research.
Ultimately Monckton was escorted out of the UN Doha conference by security personnel. Lucky for him that there are no Science Police, for if there were, his misinformation would certainly have earned him a ticket.
Posted by dana1981 on Thursday, 13 December, 2012
 |
The Skeptical Science website by Skeptical Science is licensed under a Creative Commons Attribution 3.0 Unported License. |