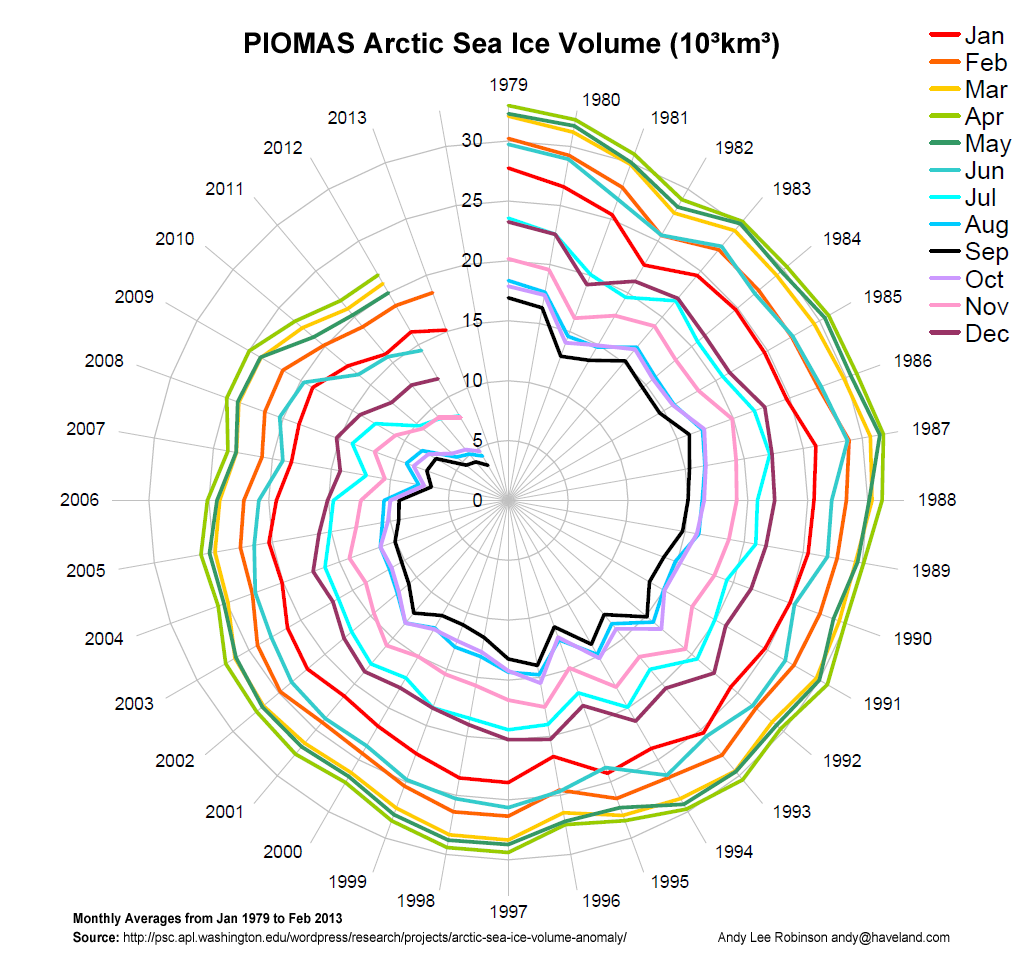
Andy Lee Robinson is the creator of several excellent graphics illustrating the rapid decline in Arctic sea ice volume. He has recently updated his Arctic sea ice volume spiral to include data from February 2013:
Here is another depiction of the same data:
He also created a graphic to illustrate the incredible loss of Arctic sea ice volume between 1979 and 2012, representing them as ice cubes on a 10 kilometer grid map of New York, and in spiral form, illustrating that the sea ice volume has dramatically declined in every calendar month since 1979.
And Robinson is also the creator of this video illustrating the Arctic sea ice mass loss, from the second figure above.
We expect to have many more updates from Robinson in the future as he incorporates new data into his excellent existing graphics and creates new ones.
Posted by dana1981 on Saturday, 16 March, 2013
 |
The Skeptical Science website by Skeptical Science is licensed under a Creative Commons Attribution 3.0 Unported License. |