I have a new paper (Richardson, 2013) in the journal Global and Planetary Change that calculates the man-made and natural contributions to changing atmospheric carbon dioxide (CO2) since 1980. It comments on a study by Humlum and others (2013) and uses the same data and part of the same approach as them, but gets a completely different answer. I do this because I follow the maths to calculate the size of each effect and I find that the entire rise in atmospheric CO2 is man-made.
Humlum et al’s paper caught my attention when it said that “CO2 release from use of fossil fuels have little influence on the observed changes in the amount of atmospheric CO2”. ‘Skeptics’ called it a ‘blockbuster’ paper and that’s a good description: if true, Humlum et al had just disproven the conservation of mass. This should put them top of the list for a Nobel prize and it was such a big deal that I read the paper twice, ran the numbers myself and then emailed Ole Humlum to check I was doing it correctly. But using maths, I couldn't come up with the same conclusion as they did, I got completely the opposite answer!
After providing enough information to check I was following his method, he then seemed to be too busy to respond to my other questions and calculations. This left me with the usual scientific way to check my work: to write a paper and submit it to a journal where it will be anonymously reviewed by experts. After these hurdles, the article is now in press.
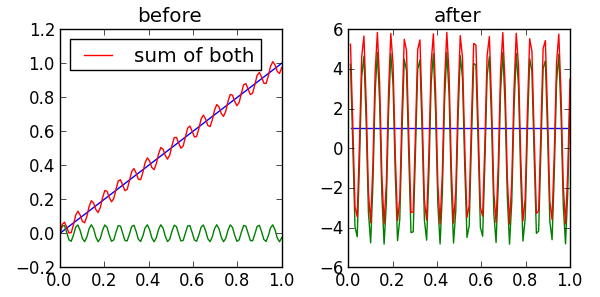
Figure 1 This shows part of the mathematical approach of Humlum et al that I had a problem with. On the left is a real signal (red), which is made up from 2 signals 'blue' and 'green' added together. The red line has wobbles from the green line, but its constant increase over the graph is entirely because of the blue line. One part of the mathematical approach used by Humlum et al is called differentiation, which turns the left-hand graph into the right-hand one. Now it looks like the red line is related to the green one but not at all to the blue one. The blue contribution has been 'hidden', but with the right maths you can find it again.
My first problem was that the amount of CO2 in the atmosphere is going up by 15 billion tons a year, and humans are emitting 30 billion tons a year. So nature's net balance must be an absorption of 15 billion tons a year from the air. If it is a net absorber, then it is not a net emitter and any opposite claim has to show how 30 billion tons of man-made CO2 is disappearing. Nature still emits some CO2 but the net effect is absorption. Just like how your bank account might sometimes have money coming in and sometimes money going out, but the overall flow might be in (lucky you!) or out.
But what about Humlum et al’s calculations showing that there is a correlation between natural CO2 and atmospheric CO2? I find that as well, but while Humlum et al only report the ‘correlation coefficient’, I go a bit further. ‘Correlation’ just means that two things change in the same direction as each other – when one goes up, the other goes up and vice versa. It doesn’t say whether it's a big change or a tiny one.
I calculate the strength of the relationship between the two and find that for every degree Celsius that temperatures go up, the CO2 in the air later goes up by 1.9 parts per million (ppm). Humlum et al didn’t report this number, but the 50 ppm rise in atmospheric CO2 since 1980 would need a 30 C (over 50 F) rise in average temperatures rather than the half a degree C we've seen. That's like warming from Greenland to Miami rather than the 0.5 C warming we've measured since 1980.
And that’s not all; not only do their results break conservation of mass, and not only do the numbers that fall out of their calculations show that the natural effect is too weak to cause the rise, but there is another mathematical misstep mixed into the method.
Humlum et al's procedure involves detrending, which measures the change in a value. If something is increasing at a constant rate, then differentiating it will turn that constant up slope on a graph into a flat one. It 'hides' any constant long term changes and emphasises any short term 'wobbles'. The graphs at the top of this post, labelled Figure 1, shows this effect.
In these graphs, the cause of the long-term increase has been hidden away by flattening the blue line. But because the red and green lines change in-sync with each other the correlation coefficient reported by Humlum et al is 1.0 (perfect correlation) between the red and the green line, and 0.0 (no correlation) between the red and the blue. Even though the entire long-term increase is caused by the blue line, there is now no correlation, and this seems to the basis for Humlum et al's conclusion about the cause of long term changes in atmospheric CO2.
What about the conclusion that human emissions of CO2 don't correlate with atmospheric CO2 change? I find that there is another step in their approach which hides this correlation.
For most of the data used, Humlum et al consider the balance of the carbon flows in terms of how much carbon changes per year, i.e. the 'speed' of carbon change. Like the speedometer on your car which might give a speed of miles per hour (or km per hour), the speed of carbon change is given as ppm per year.
That is, until it comes to human emissions of CO2. Humlum et al take public data and then perform their procedure to each of them in turn. But it appears that Humlum et al didn't realise that the human emissions data are already reported as a speed of carbon change. When they perform their detrending operation they convert this speed into an acceleration, and then they compare this acceleration with the speed of carbon change in the atmosphere. I follow the maths and suggest that we should compare like-with-like, i.e. speed-with-speed, and if you do this then the correlation between human carbon emissions and atmospheric CO2 reappears.
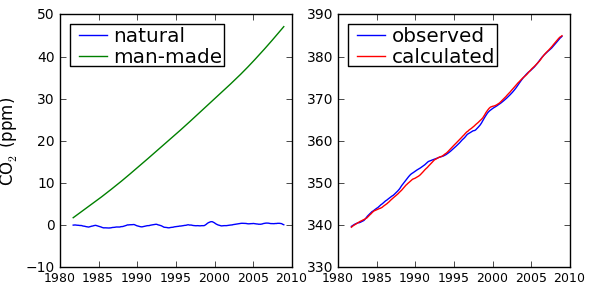
I find that the entire atmospheric increase in CO2 can be explained by human emissions, and that the natural contribution can't be distinguished from zero. If you look at the graph below, it shows my calculated contributions to the change in atmospheric CO2 individually (on the left), and on the right their sum versus the actual change. Using my approach, the calculated CO2 change is always within 0.5% of the actual value, and the entire rise in atmospheric CO2 is man-made.
I reckon this shows that when a study comes out that claims to overturn centuries of scientific studies, it's worth being skeptical until others check the results. Thanks to the universities and research groups which make their data publicly available online, I found it easy to run these checks. As more and more data goes online, this is an exciting opportunity for non-specialists (like me!) to have a go in their spare time, if they're geeky enough to be interested. But these new developments don't mean we no longer need anything from old-fashioned science. Anonymous peer review in scientific journals isn't a guarantee of perfection, but it's still a vital way of filtering out ideas which aren't properly supported by evidence, or plain old junk.
Testing old ideas is an important part of scienceand Humlum et al seemed to have found something amazing, with correlation results that certainly sounded good. But it seems that their big picture approach missed some details. In this case, the details they missed were so important that their conclusions are completely the opposite to reality.
Posted by MarkR on Thursday, 6 June, 2013
 |
The Skeptical Science website by Skeptical Science is licensed under a Creative Commons Attribution 3.0 Unported License. |