While attending the recent AGU conference, some of us were struck by a statistic presented by Professor Richard Alley: On average, a person's contribution of carbon dioxide waste to the atmosphere is forty times greater than their production of solid trash to landfills when measured as mass.
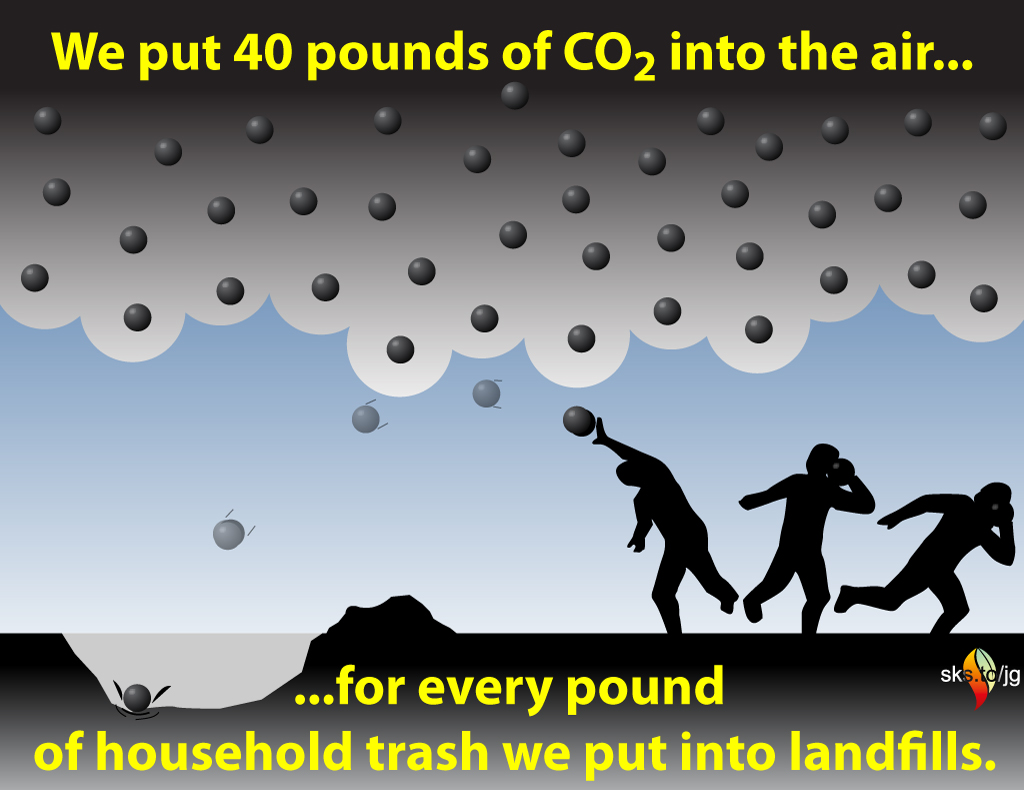
It can be difficult to grasp the huge quantities of CO2 that we emit. It’s an invisible gas with no odour and we are not used to thinking about amounts of gas in terms of mass. But we do have a good sense of how much solid waste we throw out, since we all have to lug our garbage to the curb. If we had to do the same with our greenhouse gases, instead of one can a week, we would have to haul forty.
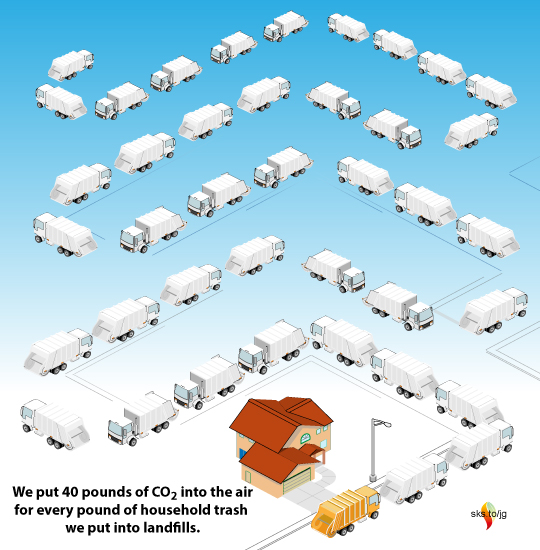
Every time we see a garbage truck, let’s imagine forty others following it, all taking our carbon dioxide to a dump site. When we hear of municipal politicians struggling to find new landfill sites, imagine the problems we would have finding forty subterranean landfill sites if we ever tried to dispose of our CO2 in the subsurface instead of dumping it freely into the air.
The EPA estimates that American households and businesses generate, on average, 4.4 pounds (2kg) of waste per person per day, of which 35% is recycled and composted and 12% is combusted. This leaves approximately 1.1kg per person per day of waste that goes to landfills. For a couple, that would be a 15kg (34lb) can of garbage per week. The average American produces about 17 metric tons of CO2 per year, which works out to 46kg each per day. Consumption of goods and energy are both linked to GDP, so it’s likely that a roughly similar CO2/garbage ratio applies everywhere, but let’s round it down to forty. (People who produce relatively little garbage probably also have relatively small carbon footprints.)
SkS authors discussed various ideas to illustrate our impressive CO2-to-trash ratio and we settled on the shot-put image to convey the weight and significance of our CO2 emissions. Imagine tossing a chunk of iron or shoe-box sized rock. For each one you toss, another forty dissolve in the air and disappear. Or do they?
About 45% of the CO2 we put in the air stays there, with 30% going into the biosphere (plants, animals and soil) and the remaining 24% is absorbed into the oceans, (Canadell et al 2007). Of course, the CO2 that goes into the ocean is changing the chemistry of the seawater, with severe consequences for ocean ecology.
Most of the CO2 in the air will stay there essentially forever, trapping heat and changing the climate for many millennia to come. According to David Archer in The Long Thaw, the CO2 emitted by fossil fuels will have an ultimate heating contribution millions of times larger than the energy released from burning it. (Archer claims the number is 40 million, David Appell argues that it is more like—a still impressive—3.5 million times.)
Unprecedented climates will be experienced soonest by those countries nearest the equator that have become adapted to historically stable tropical conditions (Mora et al, 2013). These typically poorer countries have fewer financial resources to draw upon to adapt to a changing climate. They are also countries that have done less than average to contribute to the problem, either in terms of greenhouse gas emissions or, for that matter, as garbage (e.g., see this UNEP report, page 37). Greenhouse gases have mainly come from wealthy people living in temperate climates, but the consequences of dumping of them into the atmosphere will be felt first by the poor in the tropics and later by all our descendants everywhere.
The website Carbon Visuals has some excellent info-graphics that help visualize the huge quantities of our emissions. They offer a free poster for download (pdf, 10MB).
As with all our resources, these illustrations are available to republish under our Creative Commons license.
Posted by jg on Tuesday, 7 January, 2014
 |
The Skeptical Science website by Skeptical Science is licensed under a Creative Commons Attribution 3.0 Unported License. |