This is a guest post by Alexander Ac.
The fact that last year the atmospheric CO2 concentration reached 400 ppm at Mauna Loa observatory was widely publicized. However, almost unnoticed is the fact, that according to preliminary NOAA ESRL data, global CO2 concentration increased in that same year by a record amount.
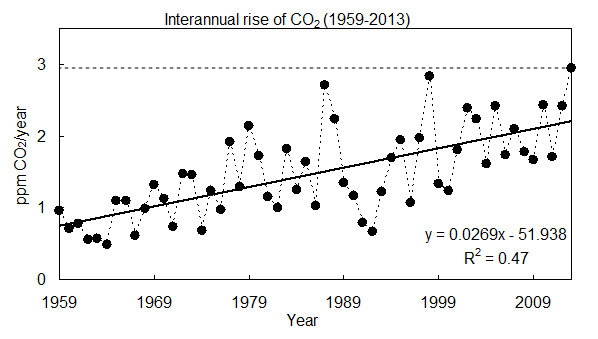
Fig. 1: Average yearly growth of global atmospheric CO2 from 1959 to 2013. The last point, i.e. 2013 might be a subject to minor corrections. Last year the concentration of CO2 has risen by 2,95 ppm, the highest growth on record. (Source: NOAA ESRL)
As can be observed, the gradual rise of CO2 is associated with a considerable year-on-year variability. The increasing long-term trend is mainly the result of rising anthropogenic carbon emissions. It is well established, that about one quarter of carbon we emit is absorbed by oceans, and second quarter is absorbed by land-based vegetation (for more details see e.g. Global Carbon Project).
The majority of the y-o-y variability can be explained by a variable land carbon sink (see Fig. 2 for explanation), as evidenced by the results of Global Carbon Project:

Fig. 2: Graph of global carbon balance. Negative CO2 flux means net removal of carbon from the atmosphere (i.e. carbon sinks) and positive CO2 flux means net carbon sources. Land-based vegetation and oceans absorb increasing amount of anthropogenic carbon, with approximately constant “airborne fraction” at around 43 %. (Source: Global Carbon Project)
During 1987 and 1998 land-based vegetation absorbed almost no carbon. This can be largely explained by the occurrence of strong El Niño during this period. Indeed, CO2 atmospheric growth is generally higher than normal during El Niño events, and generally lower than normal during La Niña events (for more details see also a study by Bastos et al., 2013).
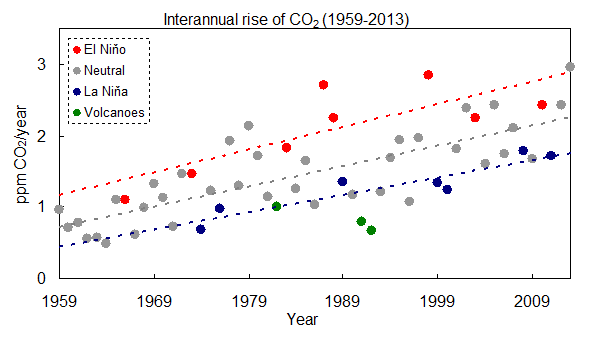
Fig. 3: Average yearly growth of global atmospheric CO2 from 1959 to 2013 during El Niño events (red circles), La Niña events (blue circles), neutral years (grey circles), and volcanic eruptions (green circles). Year where CO2 growth was influenced by volcanic eruptions were excluded from the regression analysis. The El Niño/La Niña years are according to classification by WMO. (Source: NOAA ESRL)
If we look in more detail at Fig. 3, we can see that the slope for La Niña years is slightly lower than during neutral years, and the slope for El Niño is slightly higher than during neutral years. This suggests that we should be able to observe “carbon saturation” first during hot years, and later during colder years. Indeed, a recent publication by Schneising et al. (2014) quantified the temperature dependence of global carbon rise using the SCHIAMACHY satellite data. Their key conclusion from the abstract is following (emphasis added):
“We find linear relationships between warming and CO2 growth as well as seasonal cycle amplitude at the 98% significance level. This suggests that the terrestrial carbon sink is less efficient at higher temperatures during the analysed time period. Unless the biosphere has the ability to adapt its carbon storage under warming conditions in the longer term, such a temperature response entails the risk of potential future sink saturation via a positive carbon-climate feedback.”
While there is still an ongoing scientific debate if the planetary carbon sinks are decreasing its efficiency or not, the record rise of CO2 in 2013 seems to be significant, because:
Thus if we are going this or next year to experience an El Niño event, as one recent study suggest, a CO2 rise of more than 3 ppm and possibly closer to 4 ppm should not be too surprising.
Posted by Guest Author on Thursday, 22 May, 2014
 |
The Skeptical Science website by Skeptical Science is licensed under a Creative Commons Attribution 3.0 Unported License. |