


The Wilhelma is Stuttgart’s zoological and botanical garden and is one of the many participants in the Pole to Pole campaign organised by the European Association of Zoos and Aquaria (EAZA) which represents and links 345 institutions and organisations in 41 countries. The European zoos count millions of visitors each year and EAZA aims to educate as many of them as possible about environmental and conservation issues in countries around the world. Previous campaigns highlighted the plights of tigers, rhinos, apes or European carnivores to name just a few examples. Participation of the zoos and what they offer in support of a campaign is voluntary and it usually hinges on whether or not a zoo keeps any of the flagship-species highlighted in a campaign.
Even though the Wilhelma doesn’t have many of the species connected either with the Arctic or Antarctica, the park's academic staff decided to participate in the campaign. This was what I had personally hoped for as I’m not only helping with Skeptical Science in my spare time but have also been a volunteer docent in the Wilhelma since 1991. So, this was the chance to combine both of these interests by putting together a climate-themed tour through the park in addition to two short presentations about climate change which I gave on a couple of days over the last several months.
This blog post describes the climate-themed guided tour and as the Wilhelma is not just a zoo but also a botanical and historical garden, I have included some pictures so that you can get an idea of the overall setting these tours happen in. Although climate change and science can be explained with words alone, it’s a lot easier with some graphics and I printed out several - many from our SkS-resources - which I have at hand throughout the tour. So, let’s get started!
The actual tour through the Wilhelma takes about 90 minutes and I promise that it won't take quite that long to read this post! But, it admittedly is rather long, so please feel free to pick and choose the sections you are most interested in by jumping directly to the "stops" interesting you the most. Here are the relevant links:
Flamingos - Greenhouse effect and temperature increase
African penguins - how changing ocean currents can affect their food supply
Invasive flora and fauna taking a hold
Great tits - When timing gets out of sync
Bee-eaters - moving polewards
Marine mammals - helping climate researchers
Aquarium - Coral reefs and ocean acidification
Trees - planting now for the future
Polar bears - the flagship species for global warming
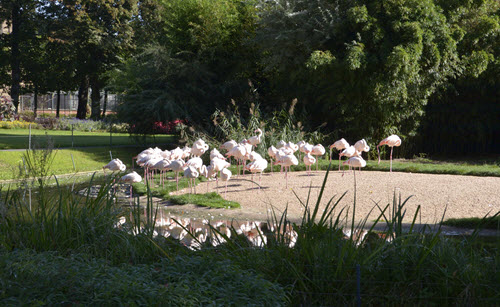
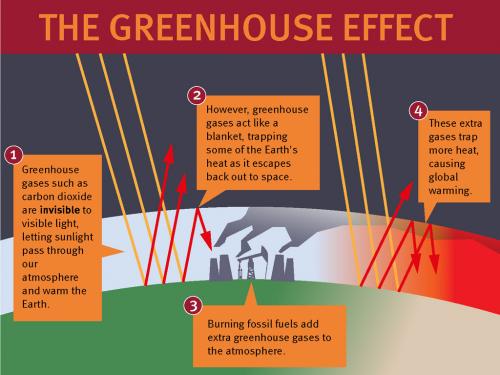
We start in the shade of two large and old ginkgo-trees, right next to the flamingo enclosure. Instead of embarking on an explanation of what can be seen there, I briefly describe the greenhouse-effect and how our emissions from fossil fuel burning enhance it, making the world warmer as a result. This is where the greenhouse effect graphic makes an appearance:
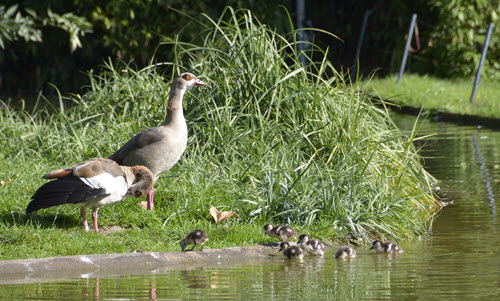
As we usually have some wild guests like Egyptian geese co-mingling with the flamingos, they make for a first good example of animals profiting from climate change, which in central Europe makes it fairly easy even for (sub)tropical species like these geese to find enough food year-round (not to mention having a 2nd if not 3rd group of hatchlings at the end of September!).
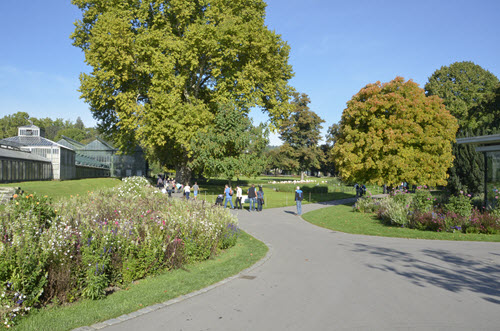
Moving along the flamingo enclosure we leave the shade of the trees and - especially on a warm and sunny summer day - the temperature difference easily is a couple of degrees warmer walking from the first stop to the second. Which is where I mention the difference between the temperature we experience as part of the daily weather and global average temperatures. This leads to an explanation of how the world on the whole keeps getting warmer compared to the baseline of 1951 to 1980 (cue: NASA/GISS graphics) and that we are accumulating extra energy/heat on the order of 4 Hiroshima bomb explosions a second (cue: heat widget). This comparison usually causes the first astonished looks.
The next stop is at the enclosure of our only (almost!) Antarctic species: African penguins. This species of penguins lives at and around the southern African coast and therefore never sees the ice of Antarctica, but for the purpose of this tour and the Pole to Pole campaign they’ll do just fine as an example.
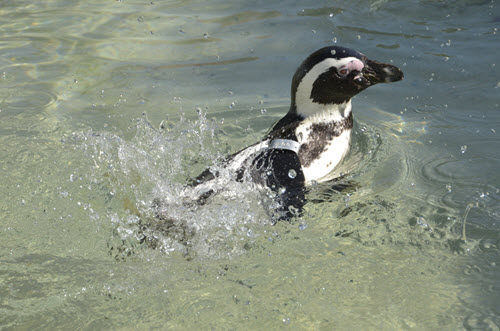
A recent study (Pollution, Habitat Loss, Fishing, and Climate Change as Critical Threats to Penguins, Trathan et al, 2014) looked at vulnerabilities for all penguin species and noted at least one established threat for African penguins: as the southern ocean warms, the productivity of the cold Antarctic currents diminishes which means that there’s less food for the penguins. When this happened during extreme El Ninos, population numbers decreased a lot. In addition, chances are that the ocean currents bringing the cold and nutritious waters from the Southern ocean north to southern Africa will change their courses due to changes in e.g. the water’s salinity. The penguins have a radius of about 40 km to find and catch their food on a regular basis and they rely on the fish coming north in those currents. So, if they are lucky, then the currents will veer towards the coast or their rocky islands, bringing the food closer to them. But, if they are unlucky, the currents will veer further away and therefore out of reach. This will happen on top of other human-caused problems they already have to endure: overfishing and oil-spills.
Walking along the house for insects and spiders, I briefly mention profiteers from global warming like the tiger mosquito which recently made an appearance in Europe and Germany and it might just be a matter of time before it starts spreading diseases here as well. Due to our winters becoming warmer and wetter, chances increase that these mosquitoes and other tropical invaders can survive through the winter months and start breeding in suitable habitats.
The common ragweed is also finding more and more favorable conditions as shown in “Range Expansion of Ambrosia artemisiifolia in Europe Is Promoted by Climate Change” (Cunze et al, 2013) and these graphs where the one on the left shows the current likelihood of it occurring and the right what is projected for 2080 (blue: less likely / yellow & orange: more likely to occur):
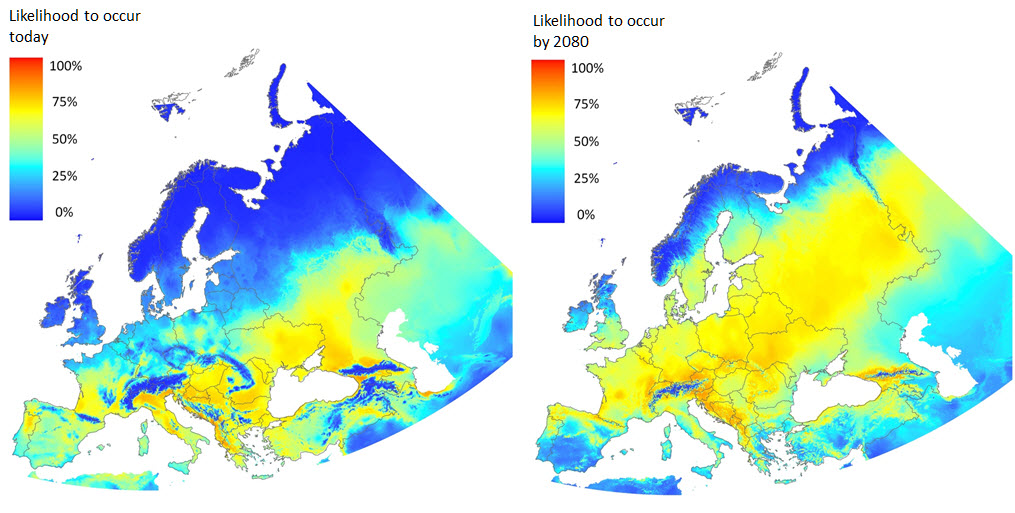 Likelihood of common ragweed occurrence - (c) BIK-F
The Wilhelma is not just a home for the animals the zoo keeps but there are also many free-ranging visitors around all year long. This offers a chance to talk about the problems some populations of songbirds like the great tit are faced with. There’s a long running project (now in its 60th year) to study a specific great tit population in a protected forest area in the Netherlands. The researchers know when these tits lay their eggs (in mid-April) and when the chicks hatch (about three weeks later). Once the chicks hatch, the adults need to provide food for them and they heavily rely on the winter moth’s caterpillars for that. These caterpillars in turn are dependent on when the oaks get their new leaves in the spring. Up until the 1980s the two events of chicks hatching and caterpillars being available were perfectly synchronised. But since then, spring comes earlier, which leads to oaks getting their leaves earlier as well and the winter moths have been able to adjust to this: the caterpillars are around earlier as well.
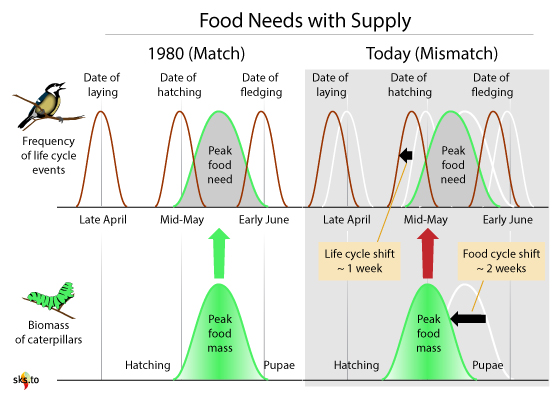 Based on the long-term study in the Hoge-Veluwe Nationalpark conducted by Marcel Visser and Phillip Gienapp (graphic: jg)
The left panel shows the situation in 1980 when the food-need and -supply were still in-sync. The right panel shows the situation today: during almost 25 years the great tits in this region have moved their egg-laying only about one week forward but the caterpillars were able to shift by two to three weeks. As a result of this, the peak availability of caterpillars is already over by the time the chicks hatch and the adults no longer find enough food to feed their young in the especially critical time 8 to 10 days after hatching. This can lead to loss of chicks in any given year and is therefore a big problem for the long-term outlook for this bird in this region (great tits in other countries seem to be more adaptable and therefore don’t necessarily have this problem).
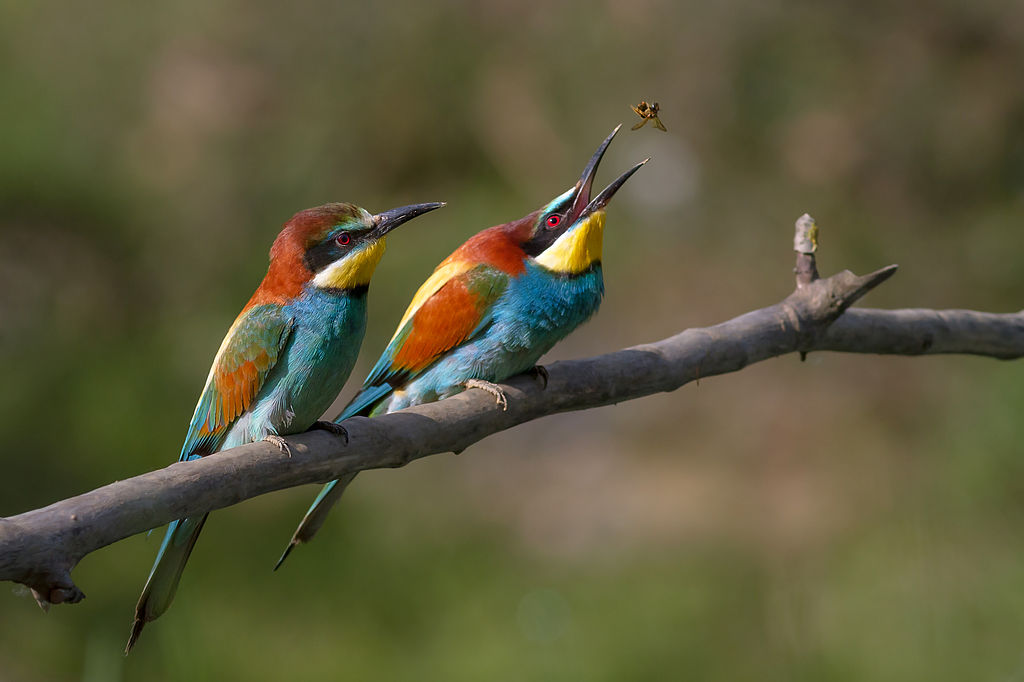 European bee-eaters (c) Wikimedia - Pierre Dalous, Ariège, France
We don’t have any of these beautiful and sub-tropical birds in the Wilhelma but there’s a breeding colony of bee-eaters a bit further to the south-west and it has been around for many years. Bee-eaters are one of the few bird species known to profit from global warming as it allows them to extend their breeding range further and further northward. Successful breeding has been recorded as far north as southern Sweden and there are sightings of these birds from way up north in Finland and Iceland.
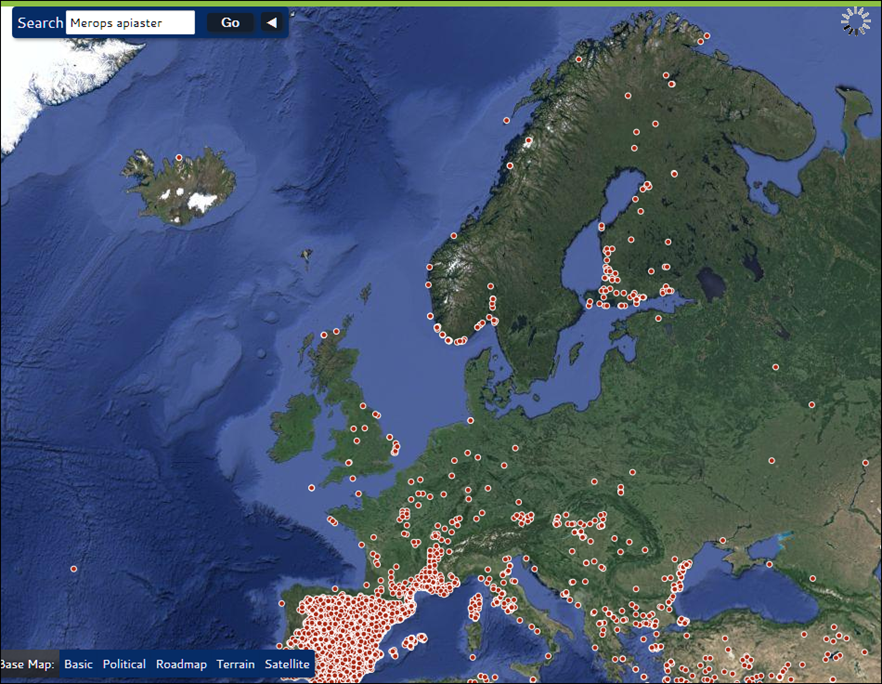 Where bee-eaters have been spotted - Map Of Life
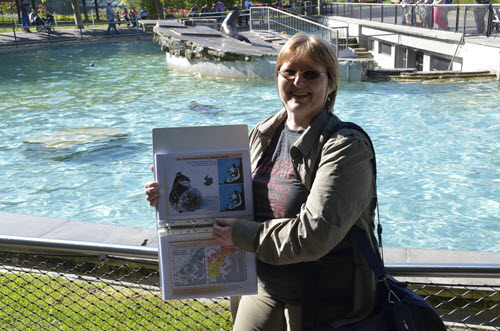
The next stop is at the sea-lions’ pool and while watching them, I tell the fascinating story of how researchers have been able to use data collected by radio-tagged individual elephant seals and Weddell seals to help fill some gaps in their climate related datafiles. To introduce this topic, I recap that our climate system is accumulating heat at an astonishing rate and that only a small part of that goes into warming the atmosphere. This is where I show the graphic “Where is global warming going”:
This graphic neatly illustrates why we need as many and reliable measurements from the oceans as possible. This aspect of climate science always gets some raised eyebrows and astonished looks because this really seems to be something few people have heard about before. I then tell them how the seals helped to discover some “missing heat” explaining the quick collapse of the Wilkins ice-shelf on the West-Antarctic Peninsula and once I show the picture of this Weddell seal, they are - just like me - all smiles:
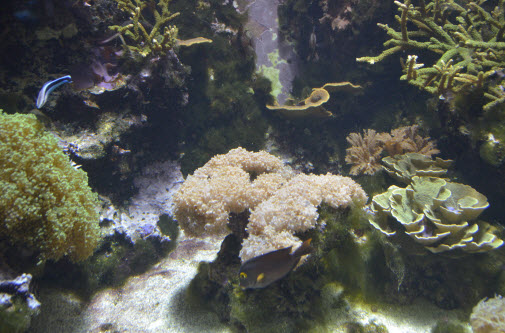
The aquarium in the Wilhelma was opened in 1967 and it contains a very large number of basins including several with living corals and some accompanying fish. Some of these small tanks are close to the entrance and I use this stop to tell people a bit about ocean acidification and the other climate-related negative effects for the reefs like warming oceans and rising sea-levels. It’s also as good a place as any to show them the Keeling curve of rising CO2 in our atmosphere - especially, but not only - because the rising CO2 level is mirrored by the falling pH of the oceans:
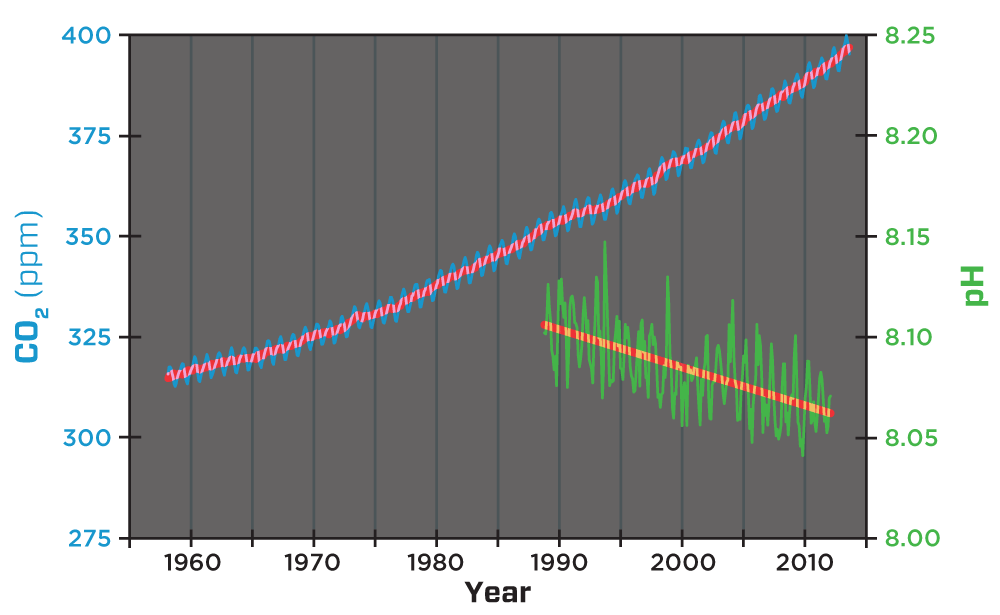
Observations of CO2 (parts per million) in the atmosphere and pH of surface seawater from Mauna Loa and Hawaii Ocean Time-series (HOT) Station Aloha, Hawaii, North Pacific.
Credit: Adapted from Richard Feely (NOAA), Pieter Tans, NOAA/ESRL (www.esrl.noaa.gov/gmd/ccgg/trends) and Ralph Keeling, Scripps Institution of Oceanography (scrippsco2.ucsd.edu)
I usually also let the participants guess what the reason for the pronounced zig-zagging of the Keeling curve might be. The explanation that this is basically our planet breathing in and out with the seasons of the northern hemisphere is yet another “I hadn’t realised that" moment in the tour for many of the participents.
To get to the next stop, we have to walk through a historical part of the Wilhelma, the Magnolia grove which is the largest such grove in Europe north of the Alps. Some of the trees are 160 years old and date back to King Wilhelm who founded the park in the mid 1850s.
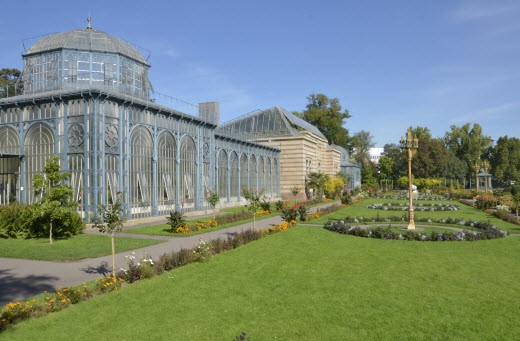
We also pass the Moorish villa and the sub tropics terraces before we take in the view of a small arboretum ahead of us.
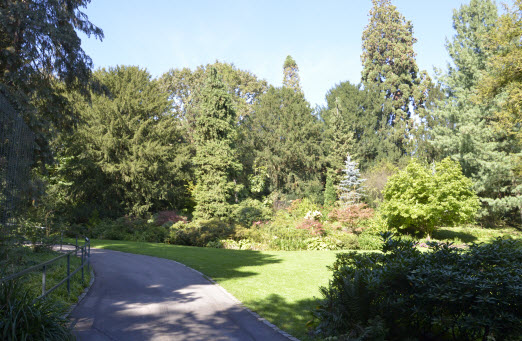
There’s at least one European spruce in this group of trees and this is one of the most important tree species we have in Germany’s managed forests. Unfortunately, it’s a northern species which isn’t well-adapted to higher temperatures and lower humidity. The warmer and drier it gets in Germany, the less viable the current places will be for spruces so the foresters already have long-term plans to replace this tree species with others more resilient to the expected changes in our climate. Forestry is a long-term and multi-generation activity and therefore needs to plant trees now which will have a meaningful yield in 50 to 100 years time. In order to do this, forest management agencies like Forst-BW (responsible for the federal forests in Baden-Württemberg) have made extensive and details maps available showing the viability of different trees in different regions.
Just as there’s almost no article about global warming without at least one polar bear picture, a climate themed tour through a zoo wouldn’t be complete without a stop at their enclosure - all the more so if the tour happens within the Pole to Pole campaign!
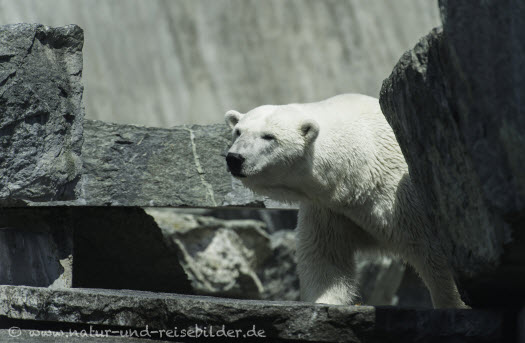
This final stop of the tour offers a chance to talk about what’s happening in the Arctic and to remind the participants that this is the region of our planet which is warming by far the fastest.
In order to highlight the plight of polar bears, I mention the big problems they face in their Arctic habitat: decreasing Arctic sea ice extent, less old sea ice and - as a consequence - the overall volume of the sea ice decreasing a lot. For the last one, I show Andy Lee Robinsons’s ice cubes and if time, weather and groupsize allows - play the short video on my iPad:
All of these factors have negative impacts for polar bears: sea ice builds up later in the year in the fall but melts earlier in the spring. This considerably shortens the time the bears have available to hunt during the winter. Younger and therefore thinner sea ice may not be thick enough to carry the weight of the bears so that they also have to swim longer distances in order to reach stable ground again from which they can hunt their favorite prey: seals. There’s at least some anectodal evidence of drowning polar bears which didn’t reach stable ice in time before they were exhausted. Polar bears caught and weighed have been found to be lighter on average, most likely due to less time they have to hunt. If it’s a female with cubs to raise, this is not just problematic for herself but she may also not have enough milk for her cubs who then die a premature death. So, all in all, the picture for polar bears doesn’t look very rosy and it shows in the population statistics available from the Polar Bear Specialists Group:
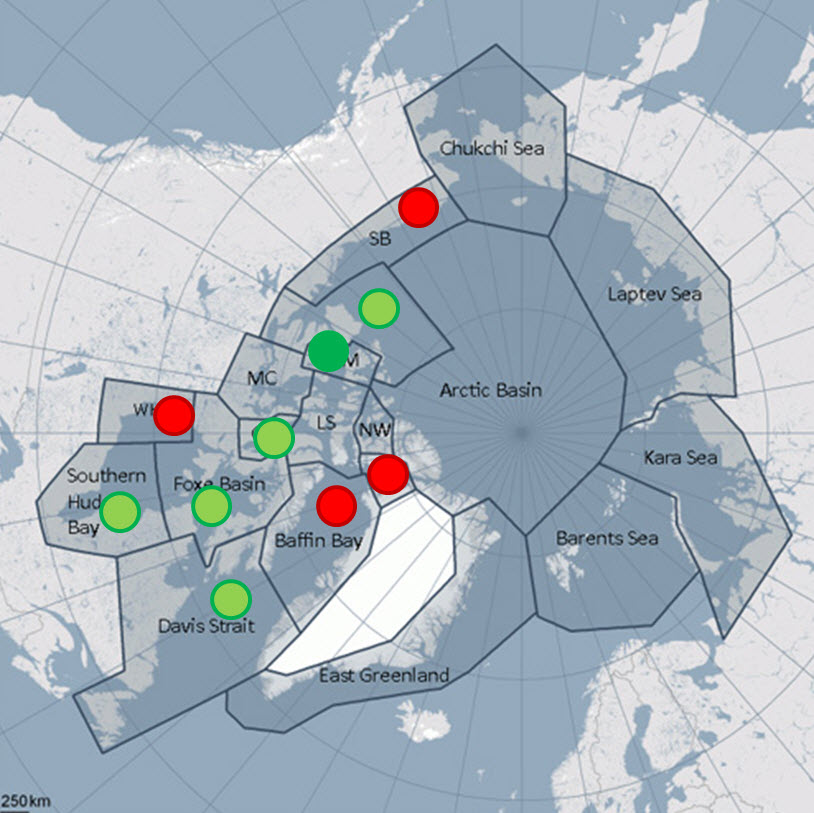 Red: declining, light green: stable, dark green: increasing. No dots: too little data
And on this not so happy note, the tour officially ends but not without making plugs for both the EAZA campaign’s motto to “Pull the Plug” and to what all we have to offer on Skeptical Science. I also give out printed copies of the German versions of the Scientific Guide and the Big Picture leaflet. More often than not, this leads to some additional discussions about what we as individuals can do to combat climate change and where to find more information. Thus far, all participants seemed to have enjoyed the tour regardless of the dire topic and outlook. I’m fairly certain that the relaxed atmosphere during the leisurely walk around the Wilhelma facilitates learning about climate change more than if the same information is shared in a classroom. But, I don’t have any scientific studies to back up this claim!
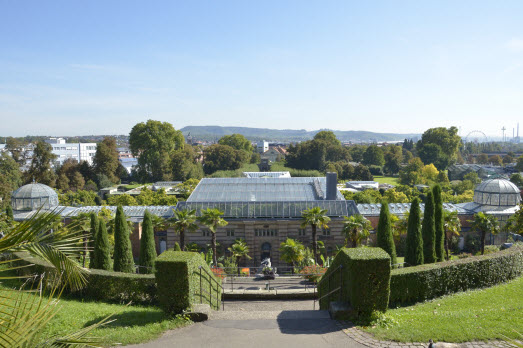
Last but not least, a final view of the Wilhelma:
Posted by BaerbelW on Monday, 20 October, 2014
 |
The Skeptical Science website by Skeptical Science is licensed under a Creative Commons Attribution 3.0 Unported License. |