This is a re-post from Richard Telford's blog, Musings on Quantitative Palaeoecology
By a curious coincidence, many climate sceptics are also ocean acidification sceptics. Some, for whom a rose by any other name would not smell so sweet, try to hide their rejection of reality behind semantics, arguing that ocean acidification should be called ocean neutralisation or ocean dealkalinisation. Others try to disprove ocean acidification with misremembered school chemistry, and yet others use dubious statistics.
There is an outbreak of the latter at WUWT, where Mike Wallace presents an analysis of ocean pH data that the ever gullible Anthony Watts finds “compelling”.
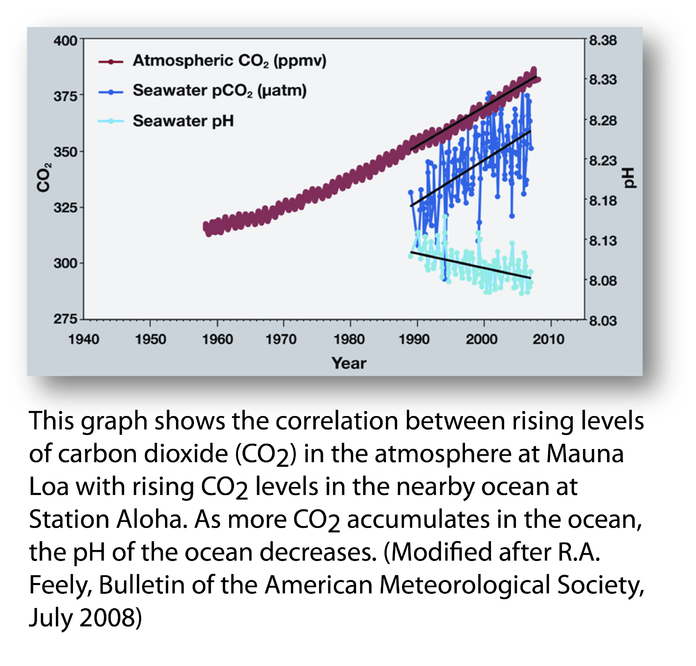
Wallace appears to have taken an objection to this figure by Richard Feely which shows atmospheric CO2 concentrations measured at Mauna Loa and ocean CO2 concentrations and pH measured in the nearby ocean.
Wallace’s complaint is that this figure omits 80 years of data on ocean pH and that this omission represents “pHraud” that “eclipses even the so-called climategate event.”
Wallace proceeds to compile all available ocean pH data from the World Ocean Atlas and calculate annual mean pH over the last century.

Wallace’s naïve analysis
A global-ocean mean pH: what could possibly go wrong?
Consider what would happen if one simply took all available temperature data used this to estimate annual mean temperatures over the last 100 years, rather than calculating anomalies and gridding quality checked data. The result would obviously be nonsense. Changing geographical and seasonal biases in data availability, and incorrect data would corrupt the analysis. Wallace’s analysis suffers from exactly the same problems.
Geographical variability in ocean pH is large. Upwelling area have the lowest pH as the water upwelling from the deep oceans has high CO2 concentrations from decomposition of sinking organic matter. The geographical coverage of ocean pH measurement is extremely unlikely to have remained constant over the instrumental period. Any analysis that fails to take this into consideration is doomed.

Geographic variability in ocean pH. Apologies for the rainbow scale.
Intra-annual variability in pH is also high. Intense photosynthesis during algal blooms can raise pH, and seasonal upwelling can lower it. If the seasonal coverage of ocean pH measurements has not remained constant over time, biases will result.
The data Wallace analysed are easily downloaded from the World Ocean Database, and the metadata examined for geographic or seasonal patterns in data availability. I’ve analysed the data on a per-cast basis. Each cast collects data from several different depths.

Location of casts by decade
Geographic patterns of data availability vary from decade to decade (and even more on an annual basis).

Season of northern extra-tropical casts by decade
The seasonal pattern of data availability in the northern extra-tropics (which represent the bulk of the data) also vary over time.
The changing geographic and seasonal patterns in data availability means that simply calculating the mean pH for each year will give all sorts of spurious trends in the analysis. Even gridding the pH data would be difficult. They are probably best used to validate model output.
Certainly, Wallace’s “compelling” analysis is junk. I hope the rest of his PhD is better than this pHoolishess.
Posted by Guest Author on Monday, 5 January, 2015
 |
The Skeptical Science website by Skeptical Science is licensed under a Creative Commons Attribution 3.0 Unported License. |