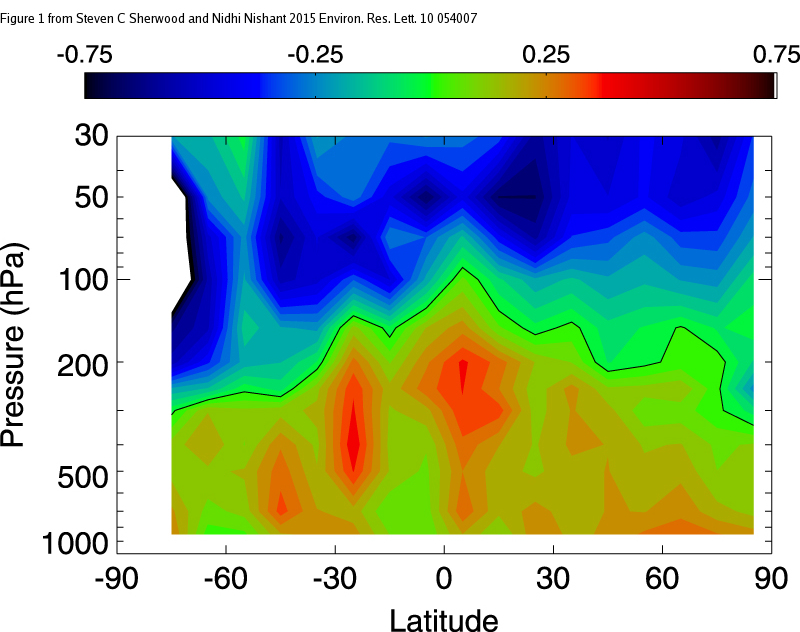
Figure 1 - Temperature of the atmosphere, by latitude and atmospheric pressure, from 1959-2012. Units are in degrees C per decade. Lower pressure corresponds to greater height in the atmosphere. Note the 'hotspot' above the equator centred about 300 hPa (about 9 km from the surface). The blue region at the top is the cooling stratosphere - confirmation of another prediction of the increased greenhouse effect. Image from Sherwood & Nishant (2015).
Because most of Earth's incoming energy from the sun is received in the tropics, strong evaporation there removes a lot of heat from the ocean surface. This heat is hidden (latent) as it is used to convert water from a liquid to a gaseous form. Readers are probably familiar with this process as it is the same one in which we are cooled when sweat evaporates off our bodies during strenuous exercise. Our skin cools as heat is used up in the act of evaporating away the sweat.
Strong evaporative uplift occurs near the equator due to the intense solar heating of the ocean there, and this forces the evaporated water (water vapour) to ascend up through the atmosphere. Because the temperature in the atmosphere decreases with increasing height (known as the lapse rate), this has the effect of cooling water vapor until it reaches a point where it condenses back into a liquid form (forming clouds and rainfall) - liberating the hidden (latent) heat into the upper atmosphere. With the great bulk of atmospheric moisture being concentrated in the tropics, this ongoing process should lead to greater warming in the tropical troposphere than at the surface.
Mark Richardson has a nice video animation of this process at about the 3 minute mark in his University of Queensland Massive Open Online Course (MOOC) Denial 101 lecture on the structure of the atmosphere.
So how does one go about measuring the temperature of the atmosphere? Although modern satellite-based instruments such as infra-red, microwave sounding, and GPS radio occultation are capable of measuring temperature and moisture in the upper atmosphere, they are not without their own issues. For instance, the microwave sounding units, the same ones that have been used to build a time series of atmospheric temperatures by the University of Alabama (UAH) and Remote Sensing Systems (RSS) research teams, offer only coarse resolution because they 'peer down' through the atmosphere. This results in the signal received at the satellite being contaminated by both the Earth's surface and the stratosphere (Fu et al [2004]), the layer above the troposphere.
The measurement technique which offers the longest record - stretching back to 1958 - is the use of weather balloons (radiosondes). These helium-filled balloons carry instruments into the lower atmosphere which measure qualities such as temperature, moisture and pressure. Unfortunately, as the name suggests, these were originally designed to gather weather data, so there is a great deal of variation in the methods and instruments used, and sampling in space and time is very patchy - especially so in the tropics. Extracting a useful temperature signal from the data has, therefore, proved to be very challenging.
Sherwood & Nishant managed to extract useful information from the weather balloon data by using a combination of statistical methods that account and corrects for bias. In their words:
"The methodology statistically corrects for incomplete sampling and step changes in bias arising from changed instrumentation or observing practises. It does this by, in effect, performing a multiple regression of the available data onto a structural model that allows simultaneously for natural and artificial changes.This preserves trends and slow variations at individual stations in an unbiased way given the structural model...."
In effect the analysis enabled Sherwood & Nishant to identify spurious trends introduced by changes in instruments and collection procedures. The authors also carried out a number of other steps to improve their results, such as rejecting stations found to be unreliable from the dataset, and the inclusion of wind vector data, but I won't bore you with the details. Perhaps the most surprising results were that the tropical troposphere was still warming robustly from 2000-2012 despite a standstill in ocean surface temperatures in the tropics (see bottom panel of Figure 2 below), and that stratospheric cooling (a signature of the increased greenhouse effect) in the tropics and northern hemisphere leveled off during 2000-2012 (not shown).
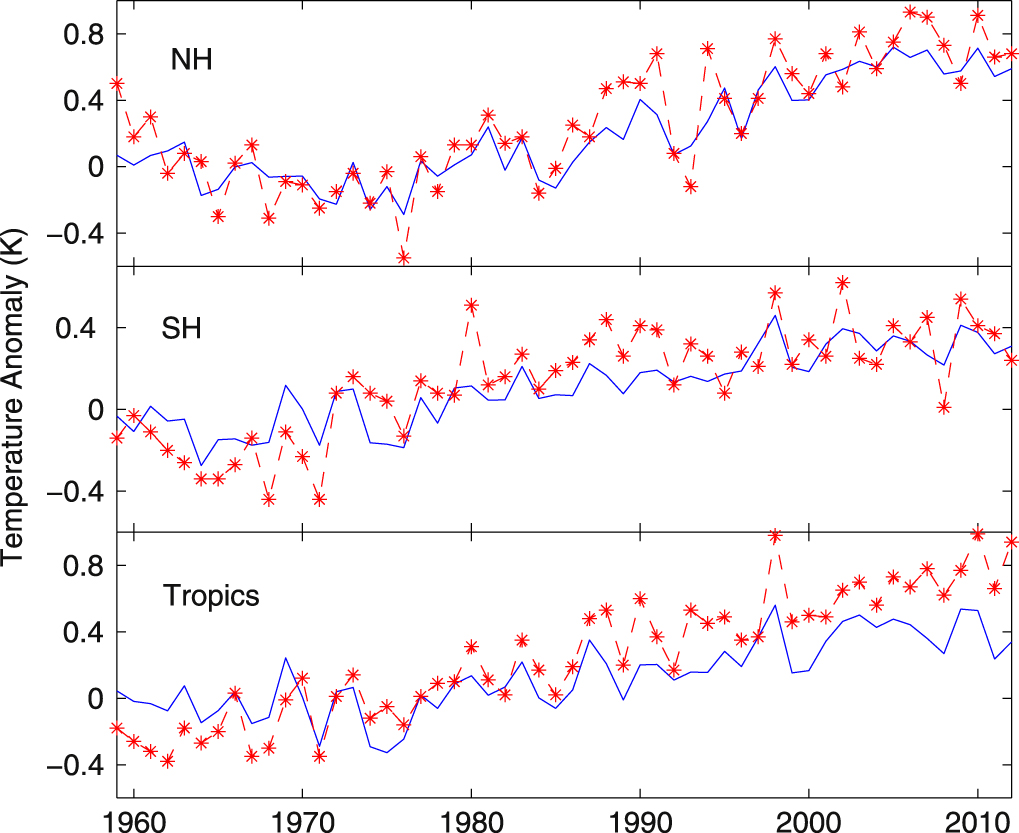
Figure 2 - evolution of tropospheric temperature (average of 850-300 hPa pressure levels) for the northern hemisphere (beyond 30N), southern hemisphere (beyond 30S) and tropics (30N-30S). The blue line is the average surface temperature trend from HADCRUT4. Image from Sherwood & Nishant (2015).
From a scientific perspective, the inability to measure the warming of the tropical troposphere has been no doubt frustrating for the research groups involved, but nothing more. In time it was likely to be resolved. For the spoof climate science blogs though, it didn't take long for this to become yet another zombie climate myth.
So confirmation of the existence of the hotspot in the tropical troposphere is not some startling revelation. It's just another ho-hum moment in climate science where the experts got it right yet again, and the spoof science blogs got it spectacularly wrong. Again.
Posted by Rob Painting on Wednesday, 20 May, 2015
 |
The Skeptical Science website by Skeptical Science is licensed under a Creative Commons Attribution 3.0 Unported License. |