There’s long been a troubling disconnect in climate science communication where we discuss the temperature charts we see from all the surface station data sets and the importance of keeping global mean surface temperature below 2C. This creates a challenge for anyone who wants to understand where we currently are relative to a 2C rise in temperature over preindustrial times.
For the average person, who might just now becoming interested in the climate change issue, how are they to comprehend this? How can we make the communication of this critical data point more clear and concise? How do we make it more relevant to the issue of climate change?
It’s important to understand that all the data sets are estimations of global mean temperature. We have multiple international groups all independently looking at the question of global temperature. Each have their own methods, and each have their strengths and limitations. And we also have hybrid estimates that attempt to combine different methods to improve on coverage and give a more accurate answer.
The surface temperature data sets (GISS, NOAA, HadCRUT4, Berkeley Earth and Cowtan & Way) are presented on different baselines and thus give us different relative temperature anomaly figures which are not specifically related to the 2C limit. For instance, HadCRUT4 baselines to 1961-1990, whereas GISS data baselines to 1951-1980. These baseline periods merely establish a zero axis for the data. Changing the baseline does not change the data, it only changes where the zero axis falls. (Tamino has a great explanation of this here.)
There is no perfect answer to the true global mean temperature of earth, but that’s rather inconsequential since we are primarily interested in understanding the change in global temperature.
To make things even more confusing for the climate newby we have many tools out there that enable us to adjust the baseline we’re looking at. All the data sets publish their data relative to a set baseline, but for researchers it can be important to test differing baselines to reveal aspects of warming. For a newby it just makes things all the more confusing, and can easily play into the hands of people for whom confusion is a desired outcome.
The 2C limit has been established and agreed to as the point beyond which we do not know what consequences may occur in terms of earth systems feedbacks. In the words of the late Dr. Stephen Schneider, “We know that there are probably hundreds of tipping points. We don't know precisely where they are. Therefore you never know which ones you're crossing when. All you know is that as you add warming, you cross more and more of them. (link)" We know that the last interglacial period, the Eemian, peaked at a global mean temperature that was about 2C over the Holocene preindustrial temperature. Warming beyond that holds a great deal of uncertainty.
While the 2C limit is somewhat of an arbitrary figure, it’s still extremely important in terms of creating effective policy responses to the challenge of global warming. Dr. Stefan Rahmstorf explains it very well at Real Climate, where he states, "Climate policy needs a 'long-term global goal' (as the Cancun Agreements call it) against which the efforts can be measured to evaluate their adequacy."
People relate to and respond to simple round figures. If you’re a man trying to watch his weight, the morning you wake up to see the scale tip over 200 lbs is likely quite a shocking thing, regardless of whether it’s only half a pound over the previous morning. Clear round figures can have an enormous effect on us.
Setting goals and understanding where one is relative to those goals is also an important aspect of human motivation. It’s an important tool for achievement most eloquently exemplified in JFK’s words, “I believe that this nation should commit itself to achieving the goal, before this decade is out, of landing a man on the moon and returning him safely to the earth.” Clear words, a clear goal. Remember, when those words were spoken, only 5 out of 10 US rocket launches had been successful, and the idea of putting a man into one of those must have seemed insane. But a mere 8 years later, in 1969, we watched Neil Armstrong set foot on the moon. Words and goals can be incredibly powerful.
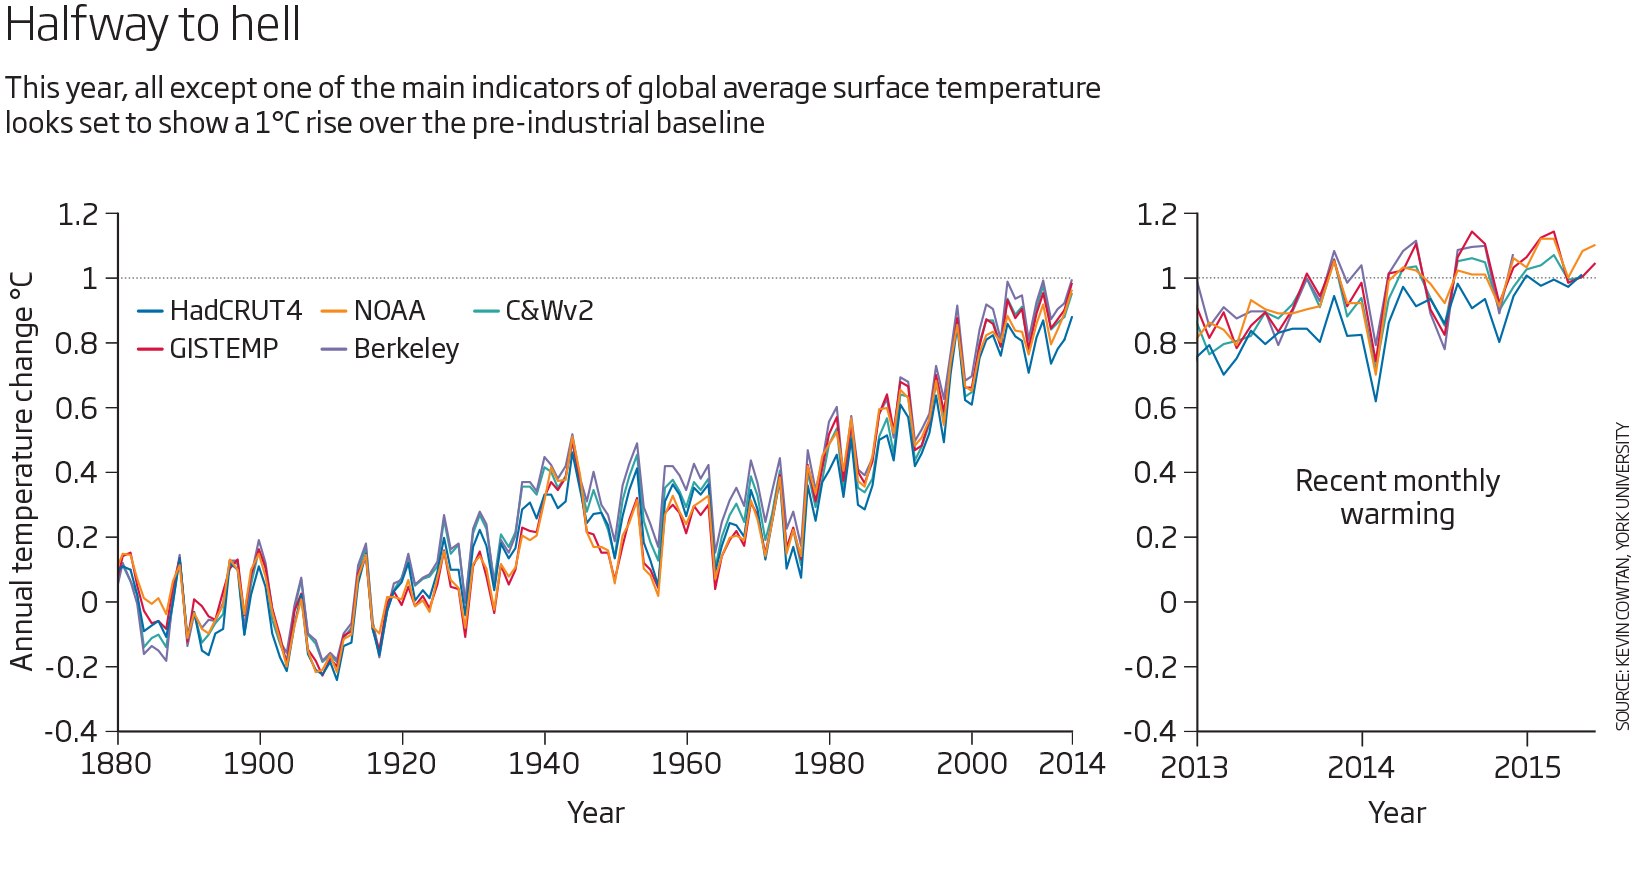
The disconnect is that all of our surface station data sets are expressing their anomalies as a figure off of differing mid-20th-century baselines, yet we’re also discussing a 2C limit that is a baseline over a preindustrial (1800's) average. New Scientist took up this question, with the help of SkS author Dr. Kevin Cowtan, for their article published last week, titled Halfway to Hell (figure below). Using 1850-1899 as a preindustrial baseline, we are this year just cresting the 1C mark over preindustrial temperature. So, in terms of a transient climate response, we are half way toward 2C.
But that’s just the transient response. That 1C has some momentum built into it. Based on the CO2 emission we’ve put into the atmosphere to date we are likely to see another 0.3C of warming within the next 30 years. In other words, almost regardless of what we do, we are already committed to 1.3C of warming by ~2050.
It would be impossible to shut down every fossil fuel source of energy in the next few weeks or months. We are going to continue emitting CO2 over the near term. The challenge is, how fast can we make this important transition to a carbon-free global economy in order to avoid the worst consequences? Glen Peters of CICERO does a very good job of explaining the challenge we face (h/t rustneversleeps). In his lecture titled A Journey from 5C to 2C, on the question of whether we can avoid the 2C limit, he says, “Yes, but only in the models.”
Get used to it. We are nearly certain to tip the scales past the 2C limit, but that doesn’t mean all is lost. That doesn’t mean give up. It means we need to work hard today to get policies in place that can help drive what's required to aggressively address this critical issue. As Dr. Peters points out, on top of the action and innovation required to transition to zero emissions, within a few short decades we’re also going to require technology that does not exist today that will allow us to remove CO2 from the atmosphere. Gasser et al 2015 (Nature Communications 6; doi:10.1038/ncomms8958), also suggests we will need negative emissions in order to stay under 2C.
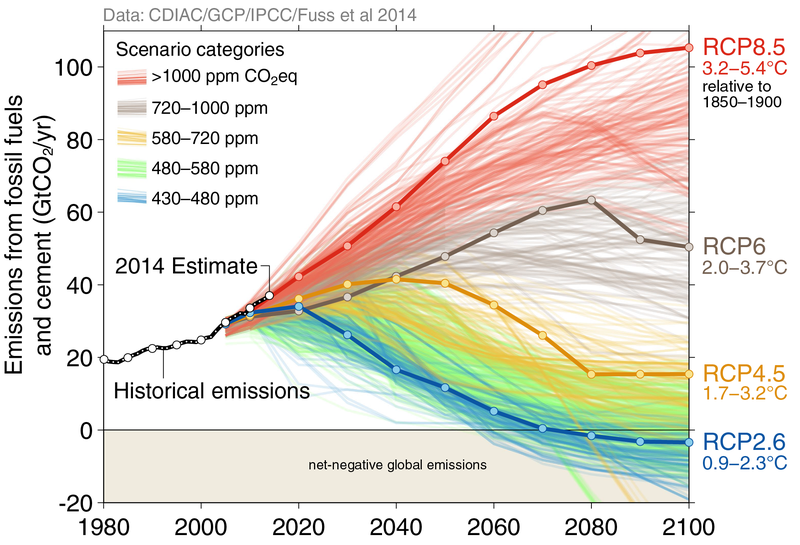
It bears noting that only the RCP2.6 emissions scenario gives us a reasonable chance of avoiding 2C, and that by a 66% likelihood. As of now, we are still on the RCP8.5 emissions pathway.
The challenge we face is made even greater by the fact that the solution requires a near complete shut down of an industry that, to borrow from Dylan Thomas, does not want to go gentle into that good night. Rather than Thomas viewing his aging father’s inevitable passing, the “rage” we face is a strapping, powerful industry of whom we must ask (or demand) to lay down and pass on for the good of humanity. We are standing in front of a Goliath of our own creation saying, “Thanks for all the fantastic energy, but you have to die now.”
In spite of the enormity of what we face, I am an eternal optimist. I believe in humanity. I believe in our ingenuity, our resilience, our capacity for creativity, and our abundant motivation to accomplish astoundingly insurmountable tasks.
Passing this 1C milestone is a strong wake up call we need to heed. Baselining the surface station data sets to preindustrial helps everyone understand where we are relative to the all important 2C limit.
Posted by Rob Honeycutt on Monday, 10 August, 2015
 |
The Skeptical Science website by Skeptical Science is licensed under a Creative Commons Attribution 3.0 Unported License. |