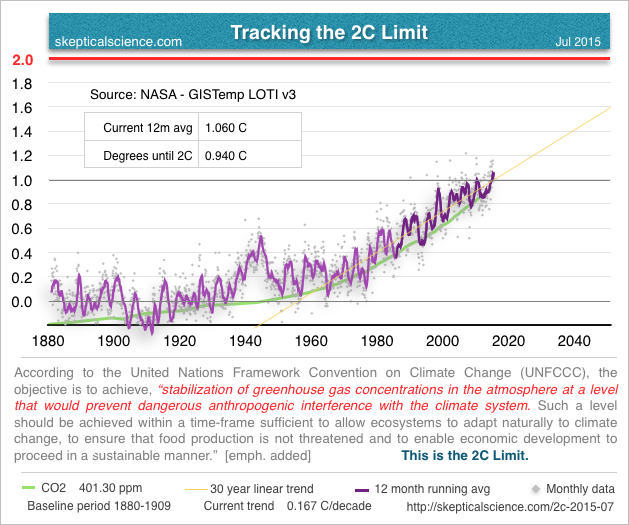
Following my last post on The 1C Milestone I've decided to build my own chart to track our progress relative to the 2C Limit. This will be a monthly post that I make here on Skeptical Science once the GISS monthly data come out.
In conjunction with these updates I'll try to throw in additional information that might relate to the 2C limit as it becomes available (or as I happen upon it). With this first post there are a few things that I'd like to point out.
I'm choosing to use NASA - GISTemp LOTI v3 data mostly because the data are published in a manner that makes it easy for me to manage. I've played around with the GISS data before and am more familiar with it than the other data sets. As new versions of GISTemp come out I will switch over to those, hopefully without too much pain.
If anyone is interested in checking out the data, you can find it here:
http://data.giss.nasa.gov/gistemp/tabledata_v3/GLB.Ts+dSST.txt
This is an issue that can trip up some folks who might be new to the climate change issue. It can be confusing as to why the surface temperature data sets use "anomalies" off of a baseline instead of actual relative temperature. NOAA has a very good short explanation about why.
What I'm doing with this data is, essentially, re-baselining it. The original data are baselined to a 1951-1980 average, making the average of those data points the zero axis. But, we want to know what the temperature anomalies are relative to a "preindustrial" baseline, in essence, so we can see how much warming has taken place since humans started pumping CO2 into the atmosphere.
The best we can to for preindustrial in the GISTemp data is to just take the first 30 years. We were already adding CO2 at that point, but that's as early as we get with GISTemp. So, we'll take it.
The World Meteorological Organization (WMO) defines climate as "weather over 30 years or more." I've added a trend line for the last 30 years of the GISTemp data, but one needs to be careful interpreting that trend.
No one that I know drives their car only by looking in the rear view mirror. That trend line is the result of what has already taken place, and is not a predictor of what will happen... and we all know you'd have to speak to Galadriel, the Lady of Lothlórien, for the privilege of seeing things that have not yet come to pass. Or just check out...
Looking at forward projections of emissions pathways is the correct way to start thinking about where we're headed. Skeptical Science author G. P. Wayne has a great introduction series to RCP's that's well worth checking out.
I found this adaptation of RCP scenarios that specifically references rise in temperature. This is the sort of information which would be more indicative of what we will see for future warming relative to various carbon emissions scenarios.
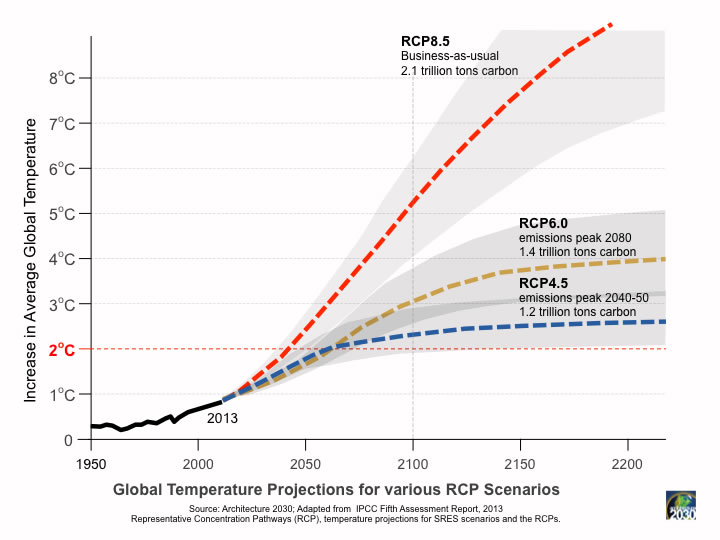
Take note that we are still currently on the RCP8.5 emissions pathway. It is imperative that we get off that track as early as we possibly can.
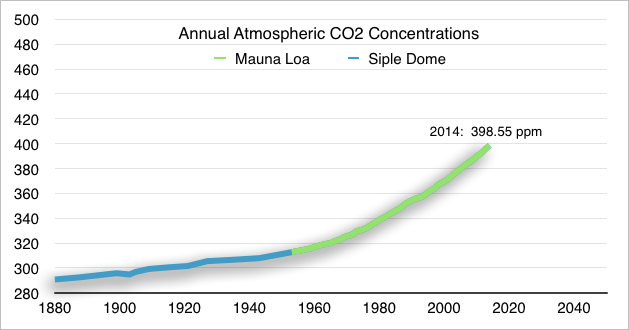
I've added our atmospheric CO2 concentrations in the background of the graph. Below is a version that gives you more detail about that data. I will be keeping this up to data along with the temperature graph.
One of my big beefs with the internet these days is with how much old information clutters up the interwebs. When I try to locate a chart, I can usually find the right chart, but I can't find the most recent chart.
With that in mind, I'm creating a very simple naming convention so that people can always find the latest data. The URL will always start with, of course, skepticalscience.com. Then if you ever want to find the latest update just add: /2c-[YYYY]-[MM].html. So, for instance, this post is: 2c-2015-07 for July 2015.
The main chart image will aways reside at: skepticalscience.com//pics/2c-[YYYY]-[MM].png
Posted by Rob Honeycutt on Wednesday, 26 August, 2015
 |
The Skeptical Science website by Skeptical Science is licensed under a Creative Commons Attribution 3.0 Unported License. |