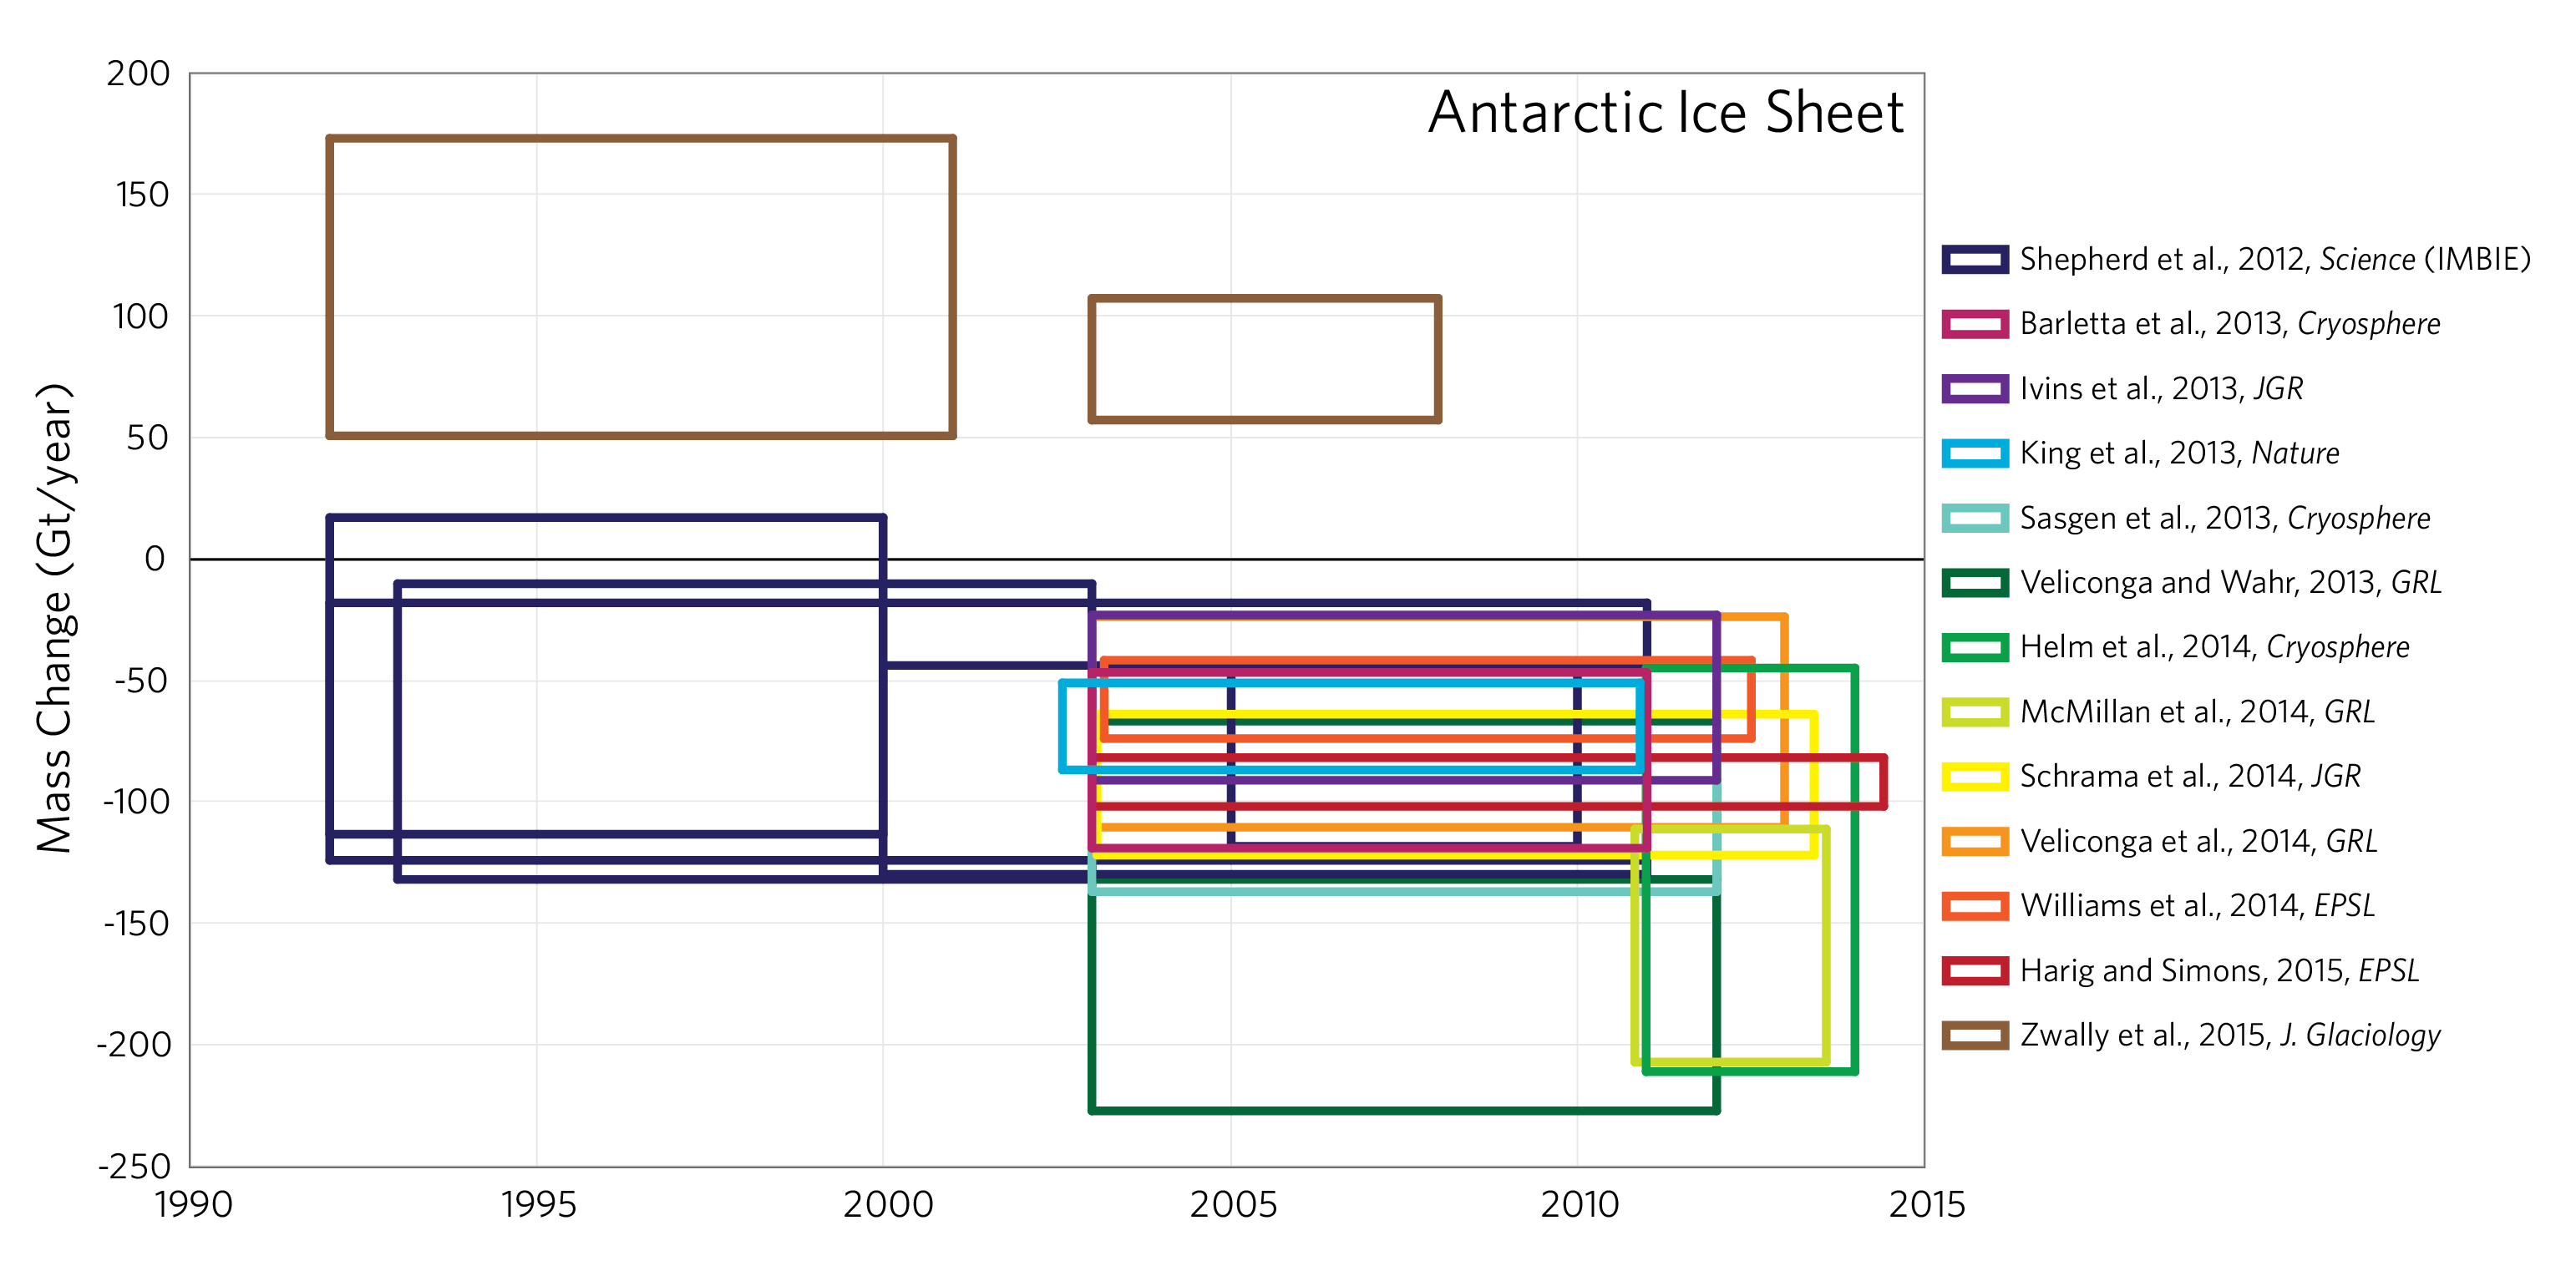
Figure 1. Comparison of various estimates of Antarctic mass balance trends. Vertical dimension of boxes gives the published uncertainty; horizontal gives the time period covered. Figure courtesy of Luke Trusel, Woods Hole Oceanographic Institution.
This is a re-post from RealClimate by Jonathan Bamber at U of Bristol
The recent paper by Zwally et al. in the Journal of Glaciology has been widely reported as evidence that Antarctic is gaining mass, and hence lowering sea level. Is it? Expert Jonathan Bamber weighs in.
There have been quite few big media stories related to Antarctica recently, including a paper on the irreversible collapse of the marine portion of the West Antarctic Ice Sheet and a NASA-funded study that finds, contrary to numerous previous results, that the Antarctic ice sheet as a whole has been gaining mass between 1992 and 2008. This most recent study received a lot of media attention because it runs counter to what was said in the last IPCC Report. Certain parts of the media hailed this as another sign that the impacts of climate change had somehow been exaggerated a risk that the lead author Jay Zwally was concerned about before the research was published.
So what did Zwally and his colleagues do, what did they find, and why does it contradict a plethora of previous studies that suggest Antarctica has been losing mass over the same time period?
Figure 1. Comparison of various estimates of Antarctic mass balance trends. Vertical dimension of boxes gives the published uncertainty; horizontal gives the time period covered. Figure courtesy of Luke Trusel, Woods Hole Oceanographic Institution.
Zwally and his team measured the changing height of the ice covering Antarctica using two types of instruments — a radar altimeter and a laser altimeter — on two different satellites. The radar provided elevation changes for 1992-2003 and the laser from 2003-2008. They compared the trends in height from the two instruments over a flat part of East Antarctica that covers subglacial Lake Vostok, finding a very good match between the trend for ‘92-’03 and the one for ’03-‘08. So far, so good (though note that they couldn’t compare the two instruments directly because they do not overlap in time.)
Using measurements of elevation change to estimate changes in mass requires knowing the density of the snow. This is the difficult part and one of the key reasons that Zwally’s numbers are so different from previous estimates. The density of snow at the surface of Antarctica is about 1/3 than that of solid ice. Most scientists working with similar data sets agree that over the last ~25 years the surface of the East Antarctic Ice Sheet (EAIS) has been going up very slightly (at about 1-3 cm a year). Previous studies employing altimetry over the EAIS have assumed that the change in elevation is due to a recent increase in snowfall and used a density of snow. They have done this primarily because the interior of the EAIS is moving very slowly and will react very slowly to changes in climate. But there is no evidence for an increase in snowfall from ice cores in East Antarctica and if anything, regional climate models suggest the opposite has been happening over at least the last decade. Zwally and his team argue that instead, mass is actually accumulating in spite of no increase in snowfall. How can this be? The answer is that the ice sheet is still adjusting to the ~doubling snowfall that took place at the end of the last glacial period, between about 18,000 and 12,000 years ago. Because the accumulation rates and temperature in East Antarctica are so low, the ice sheet has a response time to changes in climate of many millennia. So the ice sheet may still be growing even though there has been no increase in accumulation for more than 10 millennia. The difference here is crucial: if the increasing height of 1-3 cm a year is owing to recent increases in snowfall, then we should use the density of snow in the calculation. One cm of snow over the entire East Antarctic Ice Sheet (EAIS) would increase its mass by around 35 Gt (35 billion metric tons). But if the increase in height simply reflects continuing adjustment since the last glacial period, then — Zwally et al. argue — we should be using the density of ice. That would mean an 1 cm increase in height would reflect an increase in mass of ~92 Gt.
But is the density of ice the right one to use? In East Antarctica it takes thousands of years for the snow to form ice. This process is called firn densification (firn is compressed snow) and how fast it occurs depends on snowfall rates and temperature: i.e. climate. If the climate changes, then so does firn densification and the surface of the ice sheet can go up or down with no change in mass but just a change in density of the surface layers. Variations in firn densification rate can be larger than the measured elevation change, so it is essential to correct for this effect and that is usually done with a model. The model requires snowfall and temperature histories to drive it and these aren’t that well known for the EAIS. If we knew the snowfall history perfectly then there wouldn’t be any controversy!
Another problem with this type of measurement is that small biases in the laser and radar data can have a big effect when the signal is only on the order of 1 cm/year. Both instruments suffer from biases and researchers attempt to correct for these in various different ways. Each group has their preferred bias correction approach. In a previous study, published just three years earlier, Zwally and co-workers obtain a volume change from laser altimetry that is only about half the value they get in their latest study. They argue that various improvements to their bias-correction approach and some other subtle differences in processing are responsible for the difference. They also argue that their approach is superior to other studies using altimetry. But it is probably more accurate to say that it is just different, rather than better. Results from the newest satellite that can make this type of elevation measurements, CryoSat 2, which aren’t included in the Zwally et al. study, may yield a different picture yet again (Fig 2). Indeed, comparing results from CryoSat-2 height change for 2011-2014 (Fig 1) with those for 2003-2008 from Zwally and others is not very encouraging. Although inter-annual variability in snowfall is important, the estimate from CryoSat-2 is less than half that from the Zwally laser altimetry result. Such a large difference (about 110%) is more than would be expected from snowfall variations alone. This doesnt show that Zwally et al. results are necessarily wrong, clearly, this is challenging measurement to make, and translating these measurements into mass change adds yet more uncertainty.
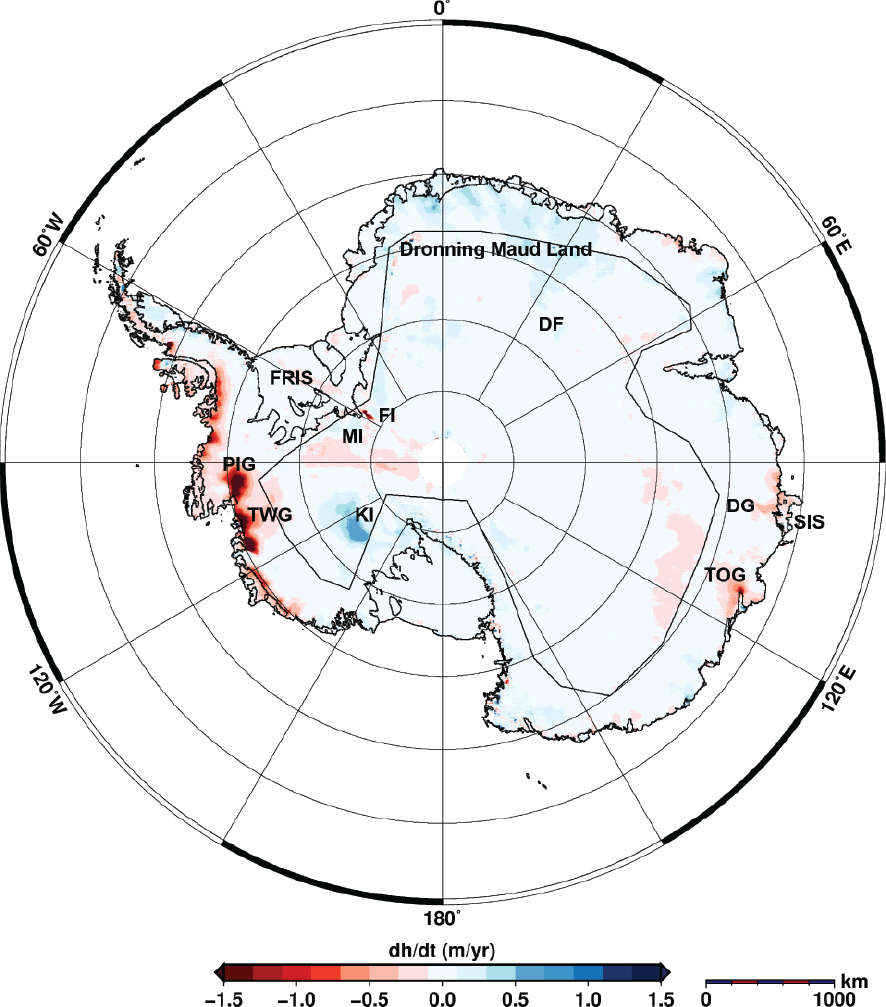
Figure 2. Elevation changes from 2011-2014 from Helm et al., 2014.
Let’s go back to the laser/radar comparison over Lake Vostok. At face value, this looks reassuring. But if you compare the trends between laser and radar data for other parts of the EAIS, the agreement is poor and, depending on the time period you chose for Vostok it can be more or less good there too. Thus, the agreement over Vostok appears to be fortuitous rather than evidence that the two instruments are measuring the same thing in the same way. And this leads on to another issue with the new study: if the thickening over the EAIS is due to a long term trend going back more than 10000 years, it should be indistinguishable from constant over the two time periods discussed. For the whole of the EAIS, the trend for 1992-2003 and 2003-2008 are the same, but at a regional scale (and by regional I mean areas that are still pretty big: the same size as a US state) things become less clear. For some regions the trend more than doubles, for others it goes from negative to positive or vice versa. Some of these differences are small and within the uncertainties. but some are not. The signal simply should not change much at all at this scale if it were due simply to long-term ice sheet adjustment.
Comparing results from CryoSat-2 volume change (not mass) for 2011-2014 (Fig 1) with those for 2003-2008 from Zwally and others is also not very encouraging. Although inter-annual variability in snowfall is important, the estimate from CryoSat-2 is less than half that from the Zwally laser altimetry result. Such a large difference (about 110%) is more than would be expected from snowfall variations.
There is another way to measure the changing mass of the ice sheet and that is to weigh it using the Gravity Recovery and Climate Experiment (GRACE) twin satellites. This mission measures gravity anomalies around the Earth every 10 days and has, for example, been able to detect the groundwater depletion in California in recent years. It can also measure the growth of mass-loss of an ice sheet, but the signal from the ice is confounded by another signal from the bedrock beneath, which is responding to changes in ice loading over thousands of years. This response is known as glacio-isostatic adjustment (GIA), and in the interior of East Antarctica we have very limited information on how big the bedrock signal is. Geophysicists have attempted to model how the solid Earth responds to changes in ice loading and, although the physics is fairly well known, some critical variables such as the viscosity of the lower mantle and the history of ice load changes are not. Zwally argues that the GIA estimates that have been used for correcting GRACE data are wrong in East Antarctica because they do not know the full ice loading history over the last ~22,000 years. Maybe. But GIA in the EAIS is poorly constrained and there is, in general, poor agreement among different estimates of GIA over the EAIS.
So what is really happening? One thing that Zwally’s study does highlight is how difficult it is to nail what is happening in East Antarctica because the signal is small and contaminated by unwanted effects that are as large or even larger. Zwally et al get a different result from previous studies because they make a different set of assumptions. Those assumptions are, by their nature, subjective and difficult, without additional evidence, to corroborate. There are, however, other lines of evidence that suggest that Antarctica is unlikely to have been gaining mass in the last few decades. That would, for example, make closing the sea level budget a whole lot harder (that is, making the sum of the sinks and sources match the observed rate of sea level rise). One other thing is certain: West Antarctica has been losing mass at an increasing rate since the 1990s and, irrespective of what is happening further East, that trend looks set to continue. Going to the other end of the Earth, the Greenland ice sheet has also been losing mass at an accelerating rate since around 1995. Greenland is now the single biggest source of mass to the oceans. These trends at both poles are huge signals that are unequivocal and uncontested.
Help us do science! we’ve teamed up with researcher Paige Brown Jarreau to create a survey of Skeptical Science readers. By participating, you’ll be helping me improve SkS and contributing to SCIENCE on blog readership. You will also get FREE science art from Paige's Photography for participating, as well as a chance to win a t-shirt and other perks! It should only take 10-15 minutes to complete. You can find the survey here: http://bit.ly/mysciblogreaders. For completing the survey, readers will be entered into a drawing for a $50.00 Amazon gift card, as well as for other prizes (i.e. t-shirts).
Posted by Guest Author on Friday, 20 November, 2015
 |
The Skeptical Science website by Skeptical Science is licensed under a Creative Commons Attribution 3.0 Unported License. |