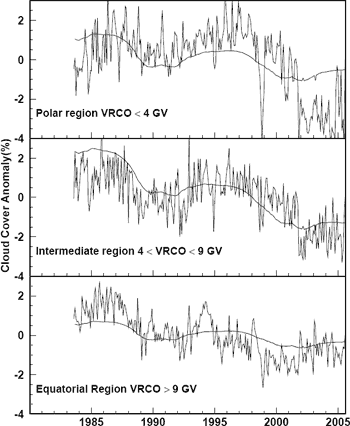
Figure 1: Lower Cloud Cover (LCC) anomaly at various latitudes. The smooth curve shows a fit of the monthly mean of the daily sun spot number (SSN) with an assumed linearly falling systematic change.
Satellite observations of Low Cloud Cover (LCC) reveal an 11 year signal that shows some correlation with cosmic radiation measurements. This has led some to conclude that cosmic rays cause cloud formation. However, LCC also correlates with other indices of solar activity such as Total Solar Irradiance and sunspot numbers. Can one determine how much cosmic radiation contributes to cloud formation?
One method is to examine cloud cover behaviour over different latitudes. As cosmic radiation particles approach Earth, they are deflected by the Earth's geomagnetic field. To reach the lower atmosphere, the particle must have enough energy to penetrate the magnetic field. A measure of the energy required is the Vertical Rigidity Cut Off (VRCO). VRCO is strongest at the equator so particles must have higher energy to reach the surface at low latitudes. VRCO falls as you approach the poles meaning more low energy cosmic rays reach the surface at higher latitudes.
This means cosmic ray flux is stronger at higher latitudes and the amplitude of the 11 year signal is greater. If cosmic rays affect cloud cover, the cloud cover variation should also be greater at higher latitudes. A new paper Testing the proposed causal link between cosmic rays and cloud cover (Sloan & Wolfendale 2008) tests this hypothesis by examing cloud cover over a range of latitudes.
Sloan & Wolfendale determined the dip in cloud cover by fitting daily sun spot numbers (inverted) superimposed on a linear trend to ISCCP satellite measurements of Low Cloud Cover anomaly. Best fits were achieved between 1985 to 1996, allowing the amplitude of the dip to be determined over solar cycle 22.

Figure 1: Lower Cloud Cover (LCC) anomaly at various latitudes. The smooth curve shows a fit of the monthly mean of the daily sun spot number (SSN) with an assumed linearly falling systematic change.
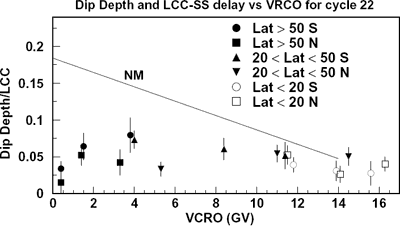
One would expect the amplitude of the dip to increase as VCRO decreases. Figure 2 reveals the amplitude of the dip is relatively constant with VRCO. This was the case both in the Northern Hemisphere where there is more land and Southern Hemisphere where oceans are more dominant.

Figure 2: Observed dip in Lower Cloud Cover (LCC) over solar cycle 22. The smooth curve labelled NM shows a fit to the fractional modulation, dN/N, measured from neutron monitors.
To identify the cosmic ray contribution to the LCC dip, Sloan & Wolfendale derived Equation 3 expressing the dip depth as:
∆LCC = ∆LCCS + K dN/N (Equation 3)
∆LCCS is the component of cloud cover due to other solar mechanisms. dN/N is the fractional change in neutron count N. K is treated as a constant. Using the shape of the neutron modulation, a fit was performed which deduced less than 23% of the LCC dip was due to cosmic ray modulation. If the correlation between LCC and sun/cosmic rays is real, more than 77% belongs to solar activity other than the change in ionization rate.
A rebuttal to Sloan & Wolfendale's paper comes from Nir Shaviv (trimmed slightly):
Neutron variations are a poor measure of ionization rates. Neutron monitors have a weak dependence on the amount of atmosphere above them. Once neutrons are formed from cosmic ray spallation at the top of the atmosphere, they easily continue to the ground because they're neutral. This implies the neutron monitor count rate will indeed be nearly proportional to the cosmic ray flux reaching the top of the atmosphere, and the latitudinal dependence will heavily depend on the magnetic cut-off.
On the other hand, the flux of ionizing particles to the lower atmosphere depends on the amount of atmosphere above. Only primary cosmic ray particles above about 10 GeV can generate showers of which their secondary charged particles can give any atmospheric ionization at an altitude of a few kilometers. The bulk of the low atmosphere ionization is actually generated by primary cosmic rays with energies a few times higher.
This implies that latitudinal dependence of the low altitude ionization rate is weakly dependent on magnetic latitude. This is because magnetic field has an effect only for cosmic ray particles of 0 to 15 GeV, which are blocked by the atmosphere. Thus, the data to compare with would not have been neutron monitor data but ionization chambers which exhibit much smaller latitudinal dependence.
Another option is to calculate actual latitudinal dependence of the atmospheric ionization variations. This was done by Usoskin 2004 who calculated actual latitudinal ionization rate variations. They found that the relative change in the LCC is the same as the relative change in the ion density (which itself is proportional to the square root of the ionization rate). Both vary by several percent from equator to pole over the solar cycle. In other words, the latitudinal dependence of the cloud cover variations is totally consistent with the CRF/cloud cover mechanism. For comparison, the solar cycle variation in the neutron monitor data is almost 20% at the poles, and 5% at the equator.
Terry Sloan kindly sent me the response he'd emailed to Nir Shaviv:
Muons, neutrons and the soft component (e and gamma) of cosmic rays are all produced from the interactions of the primaries in the upper atmosphere. So the thickness of atmosphere above them is irrelevant.
In our analysis (equation 3) we only assumed that the modulation of the ionization is proportional to that in the neutron monitors (kappa in equ 3 is the proportionality constant). Hence we fit the shape of the neutron data to figure 3, not the absolute value. There is not much long term muon data but that which exists is compatible with the assumption that the neutron modulation rate is proportional to the muon rate.
You say we should have compared with ionization chamber data - no such long term data exist either for shielded ion chambers (only sensitive to muons) or unshielded (sensitive to ionization from both muons and electrons). In any case the really interesting one i.e the unshielded case is contaminated by background from radioactivity unless the data are taken in a boat out at sea. If such data had existed we would have used them.
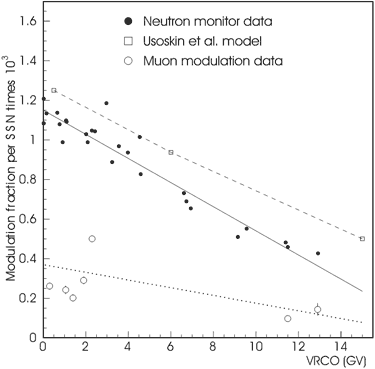
The Ususkin et al computations of the solar modulation of the total ionization in cycle 22 are reasonably compatible with our neutron monitor curve. This is true in shape and surprisingly in absolute value. So our analysis is safe.

Figure 3: Neutron modulation compared to Usoskin ionization modulation. Solid points show neutron monitor fractional change. Open squares, joined by dashed line, show ionization modulation from figure 6 of the Usoskin paper. Open circles show long term muon data.
Another interesting result from Usoskin 2004 is they find no statistically significant long term trend in Cosmic Ray Induced Ionisation (0.2 ± 0.5 cm-3/year). This leads them to conclude that:
Cosmic radiation induced ionisation is not the main source of cloud formation but rather modulates it and the long-term trend results from other processes, which are outside the main focus of this study.
This lack of trend in cosmic radiation echoes Krivova 2003 and Lockwood 2007 who found a break down in correlation between cosmic radiation and global temperatures over the past 2 to 3 decades. The question of how much cosmic rays contribute to cloud cover is an important question and a matter for further research. The lack of long term trend in cosmic radiation means the more vital question of whether cosmic rays are driving global warming has been clearly answered.
Acknowledgements: many thanks to Terry Sloan for taking the time to answer my numerous questions.
Posted by John Cook on Tuesday, 22 April, 2008
 |
The Skeptical Science website by Skeptical Science is licensed under a Creative Commons Attribution 3.0 Unported License. |