December 2015 Floods: a floating postcard from the UK
Introduction
The last few weeks of 2015 will be remembered for a long time in some parts of the United Kingdom for all the wrong reasons. Flooding, a word which for some has truly become the F-word. It has brought with it destruction and misery, accompanied by yet another round of smashed rainfall records, including national ones that have only stood since 2009, when many of the same communities in NW England suffered cruelly. Copenhagen and Cockermouth: Paris and Patterdale. The politicians thrash out their deals while on the ground the lives of ordinary folk are again put on hold. But how, and why did it happen again so soon after the last time? Let's try and get through the fog. There's a lot of nonsense that gets repeated following flooding disasters in the UK. It's a bit like the myths about climate change that this website was set up to counter: there are flooding myths too. So let's take a primer in why floods occur, look at what happened last weekend in the north of England - it was an Atmospheric River that was responsible - then examine some of the myths.
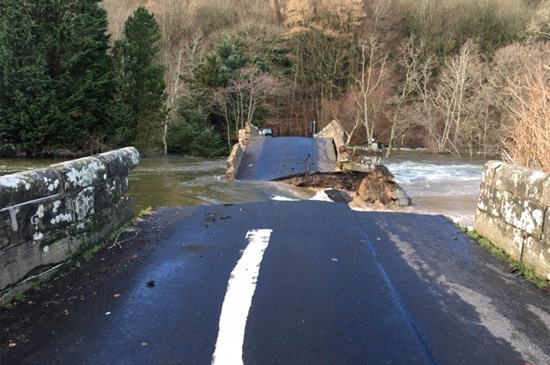
Above: the historic and much-photographed Pooley Bridge, near Ullswater and built in 1764, twelve years before America declared independence, was severed by the December 2015 floods. Photo credit: Cumbria Crack - a local news site that has pages of detailed reports on the floods for those who want to learn more. A revealing video of the afflicted old bridge, including before and after shots, is on Youtube here.
How floods occur
Floods occur when the local drainage systems are overwhelmed because the water is coming in faster upstream than it can flow away downstream. That's the obvious bit, but what overloads the drainage systems in the first place?
Rainfall rate (usually expressed in millimetres per hour) and duration are clearly important factors because in combination they determine how much rainwater has landed on any one point during a severe rainfall event. Thus we see the sudden flash-floods that result from an hour-long summer cloud-burst, consequent upon heavy convective rainfall in which it can rain at more than sixty millimetres per hour as the thunder rumbles around the hills. In general, although common, thunderstorm-related floods tend to be short, sharp and localised, although there are some well-remembered examples such as the Boscastle flood of 2004 which were far more serious. Conversely, long-duration falls at rates of ten millimetres per hour over very wide areas can cumulatively deliver far more rainwater to multiple river catchments, leading to very extensive and sometimes severe flooding.
However, an equally important factor is what happens to that water when it hits the ground. The take-up of the water by the ground now becomes important. Take-up is determined by the permeability, not just of the soil but also of the underlying bedrock. Thus, a well-wooded hill with a deep sandy soil sat atop permeable sandstone can handle a lot more rainwater than a bare, grassy hillside with a thin soil developed upon impermeable glacial boulder-clay on top of equally impermeable slate. And, unfortunately, the latter scenario is the one that applies to much of the UK's formerly-glaciated western seaboard with its mostly impermeable Lower Palaeozoic or older bedrock.
Wooded areas can soak up more rainwater than bare slopes, but if the substrate is impermeable, as in the above example, it only takes a few wet days for the next factor to become important – ground saturation. Once the ground becomes saturated, it does not matter whether it is wooded or not – the rainwater cannot get into the ground and instead runs off downhill. A frequent occurrence in the western hills here is for the water to flow along the surface of the impermeable boulder-clay, beneath the thin soil and turf. What often happens is that the water will run downhill in this manner until it starts to accumulate in a boggy hollow, where its fluid pressure starts to build up. The whole surface of the bog becomes raised, like a huge green blister, until ground failure occurs due to the overwhelming pressure exerted by the water. In turn, the water all emerges at once, mixed with the debris created, gouging its way down the hillside. Such “bog bursts” as they are called are a lot more frequent in these hills than many people realise.
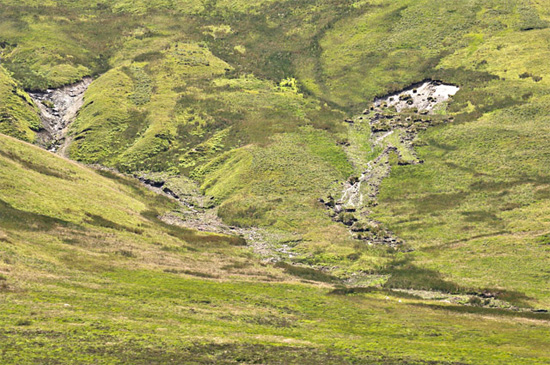
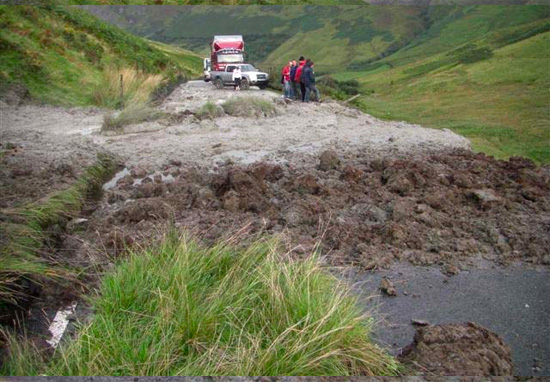
Two images showing bog-bursts after heavy rain. The one above is on Plynlimon in Mid Wales and shows the classic debris-train downslope. The one below shows the immediate aftermath of one blocking the main A470 road near Dinas Mawddwy, Gwynedd, North Wales. Peat and scoured-out boulder clay, grass-clumps and rocks make up the debris. Photos: author and Richard Street.
Such factors all apply to the recent flooding disaster that hit Cumbria on December 4th onwards. These once-glaciated hills, composed of impermeable slates and igneous rocks and draped in a mantle of impermeable boulder-clay, stand in the face of the prevailing sou-westerly winds. That in turn sets them and other western UK hilly districts, like Snowdonia in North Wales, straight up for that phenomenon that is a familiar part of UK weather – the Warm Conveyor and its evil cousin, the Atmospheric River.
Warm Conveyors and Atmospheric Rivers
Warm Conveyors occur on the south-eastern flanks of Atlantic low pressure systems, within their warm sectors. They feature extensive south-westerly windfields, thousands of miles across and long, often with a long fetch out over the warm subtropical Atlantic. Readers will be familiar with the important relationship between air temperature and its ability to hold moisture: for every degree Celsius of added warmth, air can carry up to 7% more water vapour. In Warm Conveyor situations, the air can make use of the vast source of evaporating water vapour that is the ocean surface. Within Warm Conveyors there occur Atmospheric Rivers, which are bands, up to a few hundred kilometres in width but thousands of kilometres in length, of intense moisture flux. They are confined to the lower troposphere, typically extending from between 1 to 2.5 kilometres above ground level. When I say intense I mean just that: it has been calculated that the moisture transported by the Atmospheric River that caused the massive Cumbria flooding on November 19th 2009 was more than 4500 times the average gauged flow in the River Thames in London!
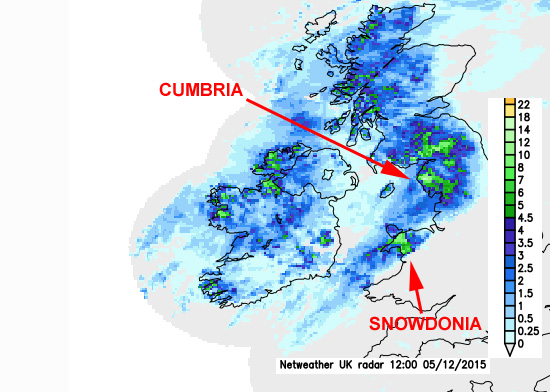
Above: rainfall radar from Netweather showing heavy rain from the December 5th 2015 Atmospheric River. The hills of western Ireland, Snowdonia and Cumbria are bearing the brunt of the rainfall. Rainfall rates are in millimetres/hour.
When Atmospheric Rivers reach the UK's western seaboard that's where the problems start: they are forced up over the mountains. That forced ascent, of 500-1000m, cools the air and it then sheds its moisture copiously. In Atmospheric River situations, the rainfall radar typically shows light rain over the Irish Sea and the coast. Immediately inland, over the mountains of Snowdonia and the Lake District, there is continuous moderate to heavy rain. This effect, determined by the topography, is known as orographic enhancement. Conversely, any lower ground east of the mountains sees much less rain – a classic example of a rain-shadow.
Atmospheric Rivers that lead to serious flooding in the western UK (and in some cases downstream from it - for example the Severn catchment, fed by the Welsh mountains) are those that remain in the same position for prolonged periods of 24 hours or more, soaking the same area constantly. Some recent examples include a 48-hour event on 3-4 February 2004 that affected Wales. In just two days, 261 mm (10.27 inches) of rain fell at Capel Curig and flooding was widespread and locally severe. The event of 18-19 November 2009 affected large areas of Ireland, North Wales and, worst of all, Cumbria. At Seathwaite, in Borrowdale, Cumbria, 316 mm (12.44 inches) of rain fell in 24 hours, setting a new UK record for any 24-hour period that had stood unchallenged ever since violent summer thunderstorms settled over Martinstown in Dorset one day in July 1955 and dropped 279 mm (10.98 inches) of rain on the place. The November 2009 Seathwaite event total, 396 mm (15.59 inches) over 48 hours, also set a UK record – for the time being.
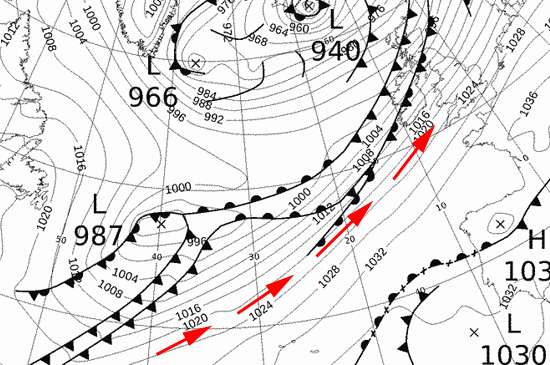
Above: UK Met Office synoptic chart for 00z Saturday 5th December 2015. Warm conveyor indicated by red arrows.
The Cumbrian flood disaster, 4th December 2015 (ongoing)
On December 4th-5th 2015, the Atlantic was dominated by a huge low pressure system with a deep centre of around 940 millibars situated over Iceland. A second low at 987 millibars was situated several hundred miles off Newfoundland. The resultant Warm Conveyor to the south of these big extratropical cyclones stretched across the Atlantic, from well to the south-west of the Azores right up to NW Europe. Within the warm conveyor, an Atmospheric River piled head-on into Ireland, Northern England and Wales. Rain started to fall over the Cumbrian mountains on the evening of the 4th. By the evening of the 5th, the UK 24-hour rainfall record had been smashed, with 341 mm (13.42 inches) of rain falling at Honister and 322 mm (12.67 inches) at Thirlmere, where an event-total over two days of 405 mm (15.94 inches) was also recorded – a 48-hour UK record.
Little needs to be said of the consequent flooding and misery as the images and footage have found their way all over the world. The most interesting of the images are those not from downstream in the flooded towns and cities, but from ground zero where these incredible rains actually fell. The flanks of the mountains are scarred by multiple bog-bursts. Debris-cones of stones, boulders and smashed trees litter the roads almost everywhere. Check out this ITN video to see for yourselves. Much of the arterial north-south road the A591 has been completely washed away at one point. Bridges, hundreds of years old in some cases, have been severed.
The Mayor of the afflicted Lakeland town of Keswick had this to say:
"The flood defences were designed for a one in 100 year event and since it's six years since we had the last one, we were sort of surprised that we got one so soon. I think they did work but they were just completely overwhelmed by just the sheer amount of rainwater we had. The river was 5.4 metres above ground this year. In 2009 it was 4.6 metres. And 4.6 metres had sat there as the target that we never wanted to breach again."
Whilst the whole science of weather event return periods is misunderstood by many (it's what is thought to be possible and not what will definitely happen), one can certainly feel a degree of sympathy for the bloke.
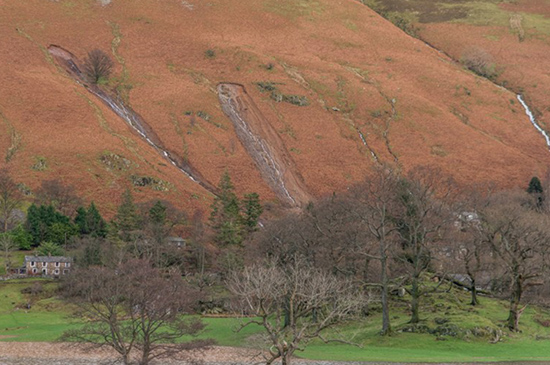
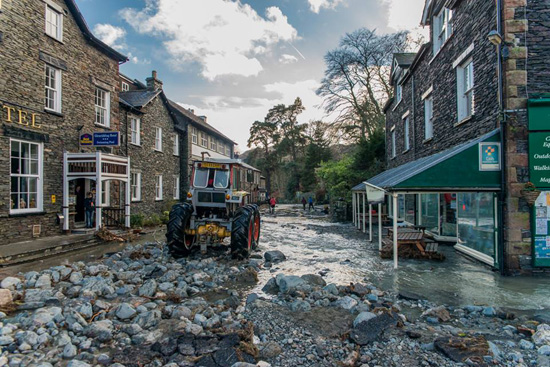
Above: multiple bog-bursts along the lower slopes of the hills flanking Patterdale, Cumbria. Below: the aftermath in Glenridding, Patterdale, Cumbria. Boulders strewn along the street bear testimony to the force of the water at the height of the flooding. Photo credits: Beyond Imagination Photography.
Atmospheric Rivers: will climate change affect them and how?
So, how can climate change affect Atmospheric Rivers? There are two variables to think about. Firstly will there be a change in the number of Atmospheric Rivers? Observed Atmospheric River inter-annual variability was, as of 2013, between about 2 and 14 such events per winter. Any change in frequency will depend on how synoptic patterns and large-scale circulations might be affected in a warmer world. Secondly, will there be a change in their intensity? All other things being equal, there should be: mid-latitude atmospheric water vapour content is expected to increase in a warmer climate (note the 7% per degree celsius noted above). In turn, that indicates that if Atmospheric River distribution and frequency remain the same, the risk from them is going to grow because they will, basically, be moister affairs.
Lavers et al (2013) (here, open access) decided to investigate how things might pan out in the North Atlantic. They used 6-hourly output from the latest global climate model simulations produced under the Coupled Model Intercomparison Project Phase 5 (CMIP5). Five models were considered; for each one, four simulations were retrieved. These comprised Historical and Atmospheric Model Intercomparison Project runs for the period 1980–2005 and two future projection simulations - RCP4.5 and RCP8.5 to reflect the radiative forcing changes at the end of the 21st century, assessed over 2074–2099.
The Historical runs firstly showed that the CMIP5 models are capable of resolving Atmospheric River structures and thus they are capable of capturing the relevant atmospheric mechanisms responsible for generating them. In turn, that tells us that the models are capable of producing the Atmospheric Rivers that are observed in the real world: so far, so good.
After establishing that the CMIP5 Historical simulations are able to represent Atmospheric Rivers, it was time to look to the future. This is what they found. For all models, there was an increase in Atmospheric River frequency - in RCP8.5, the high emissions scenario, the figure was a doubling. In a bad year, that could mean, in a worst case scenario, 28 such events. They also found that under current climate change scenarios, Atmospheric Rivers would become more intense, so that there would be more of them and more potent, too. The changes were found to be largely thermodynamic in origin, something which is consistent with a response to anthropogenic climate forcing. They concluded that the large multi-day rainfall totals associated with Atmospheric Rivers over the UK were likely, in an unmitigated scenario, to intensify. This, of course, would mean more frequent and bigger winter floods.
Some flood myths and remedies
So what of the myths? A very frequently-encountered one is that floods occur when flood-plains are built upon. Now, that may well hold true for localised convective downpours. But remember that it is primarily the mountains that are affected by Atmospheric Rivers. The flood-plains, whether built upon or not, simply become submerged by the water coming from the mountains.
A variant of the “climate's always changed” myth is often applied to flooding, pointing out that flood plains very often contain modern buildings that get flooded. That myth can be summarily demolished in this case by pointing out the centuries-old bridges that were, in some cases, summarily demolished themselves. Properties old and new will have to be gutted and restored after the Cumbrian floods.
Another one that crops up is that dredging and straightening rivers would solve everything. All those processes do, however, is to give the wings of speed to the floodwater coming down out of the mountains. It shoots off at ever greater volume and speed until it reaches a pinch-point downstream. This may be something as simple as a large fallen tree, but whatever it is will pond up the water there so that it will rapidly start backing up until the river bursts its banks. Or it may be a bridge in the middle of a city, in which case all low-lying communities upstream are at risk from inundation. In fact, restoring old flood-plains, with their meander systems and vegetation, has in the rare cases where it has been tried, resulted in improvements with otherwise rapid run-off slowed down. In Cumbria, such restoration was successfully tried on the River Liza in Ennerdale: it's a relatively small Lakeland catchment at 168 km2, compared with the 1,235 km2 of the nearby Derwent, with all that implies in terms of rainwater volume loading, but where floodwaters can be slowed down it has to be worth the effort.
Extensive replanting of bare slopes in the uplands clearly has some positive effects. A study (Marshall et al. 2014) involved establishing a series of plots at a number of pilot sites in Wales where rainfall runoff and ground infiltration could be monitored. At two of the plots at each site, the following conditions were imposed: a) exclusion of sheep and b) exclusion of sheep and planting with native broadleaf tree species: the third plot at each site was just grazed as normal as a control. They found that runoff volumes were reduced, sometimes significantly, in ungrazed and tree-planted plots. After five years, average soil infiltration rates were 67 times greater in the tree-planted, ungrazed plots. However, as pointed out earlier in this post, if the substrate or bedrock are impermeable and an Atmospheric River comes along, a saturation-point will still be reached, particularly if the season has already been very wet. Nevertheless, it is another weapon in the armoury with which to combat flooding.
However, the most effective solution of all is to develop effective climate change mitigation strategies. They will not cancel all future flooding – obviously – but given recent events and the findings of Lavers et al, we need to stop the situation getting any worse than it already is. Floods are expensive: the 2009 Cumbria floods cost at least £275 million, never mind the cost in terms of shattered lives, something it is impossible to express in terms of pounds, shillings and pence.
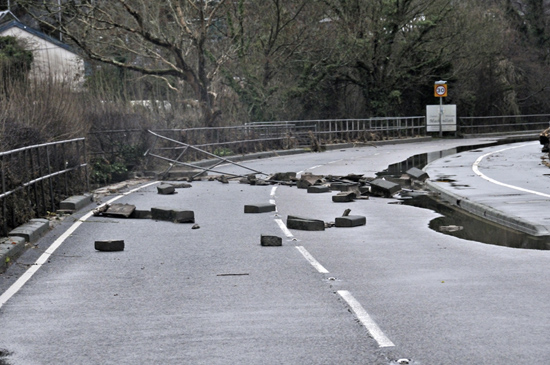
As a brief afterword, on Saturday December 12th the COP21 delegates were putting the final details to their agreement. Here in the Dyfi Valley in western Mid-Wales, the rain was incessant and lashing. Another Atmospheric River had paid a visit. By the evening, the Dyfi had risen to within a centimetre of its record level, that had stood since November 18th 2009. Disruption was widespread due to flooding and landslides. The image below, taken the following day, shows railings and large kerb-stones ripped out by the floodwaters and strewn across the main A487 trunk-road just north of Machynlleth. Capel Curig, a few tens of miles to our north, recorded 92mm of rain in 24 hours. We suspect a similar amount fell over the hills around the Dyfi Catchment. This morning (December 16th), the rivers are rising again after another wet mid-December night in which the temperature fluctuated between 13-14oC at the nearest Met Office weather-station, at Trawscoed. Enough is enough!
Posted by John Mason on Wednesday, 16 December, 2015
