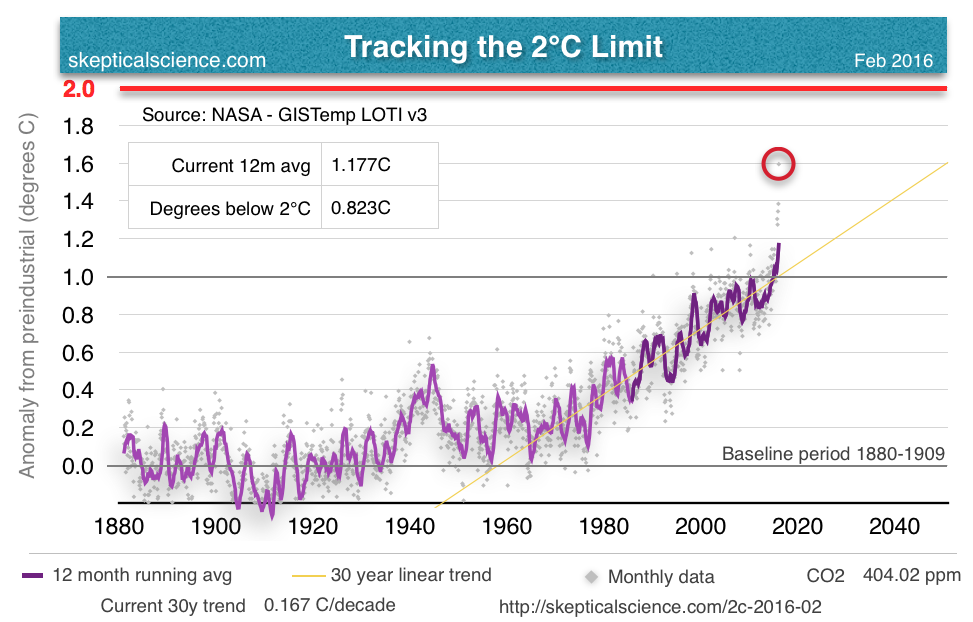
February has seen yet another record anomaly in the GISS data, and this one is another large jump up from last month's anomaly of 1.14°C. GISS just reported February 2016 at 1.35°C. The next highest February anomaly was 0.88°C in 1998, so February 2016 is a full 0.47°C warmer than that. (Full size graph here.)
The satellite data are also starting to show a strong response to the El Nino. In January, Roy Spencer made the comment that, "We are now approaching peak warmth in the tropics due to El Nino conditions. Only time will tell if warming continues for a few more months, or whether January was the peak." It's not entirely clear to me whether he's talking about the peak in sea surface temps or whether he was expecting the January UAH data to have peaked, but February came back and blew January out of the water (so to speak).
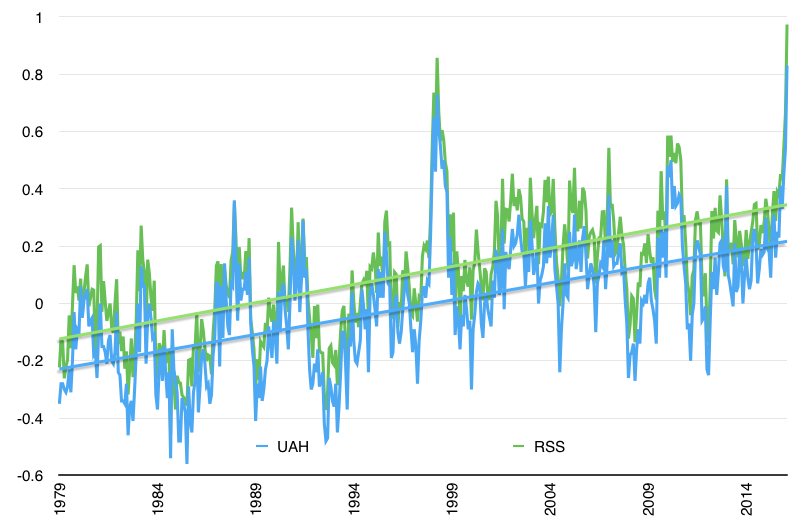
Both RSS and UAH data showed a very sharp rise in temperature for February. (Full size image here.)
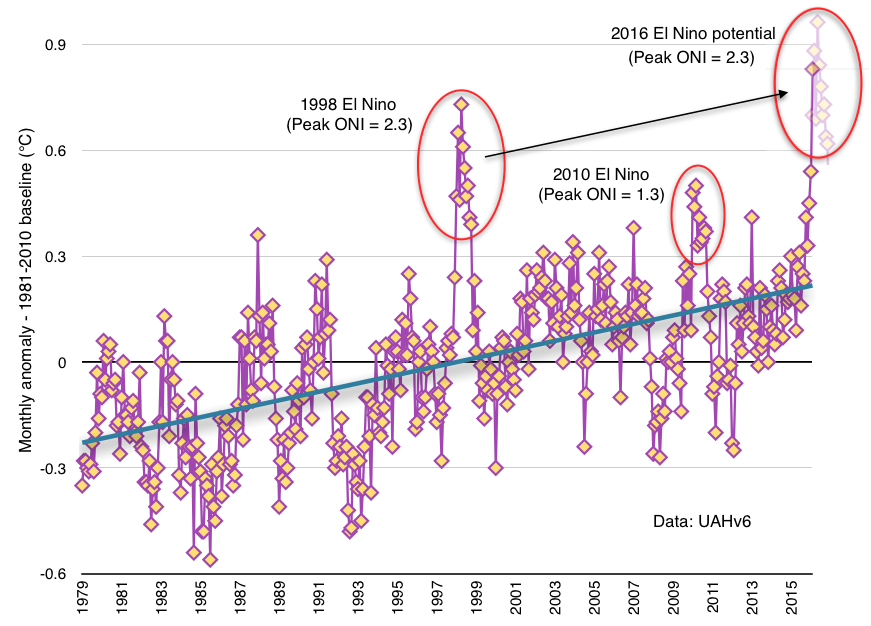
If you've been following these posts, you'll remember I'm also tracking the Ocean Nino Index (ONI) relative to the satellite data. I'm now tracking this for both UAH and RSS in different charts. If 2016 plays out anything like the 1998 El Nino, we're in for many more months of similar temps before they fall back to the long term trend. (Full size image here.)

I came up with a simple graphical way for estimating what might happen over the coming months, again, if the satellite temperature data behaves similarly to 1998. (Full size image here.)
This suggests that we could be in for most of 2016 ranging in the same temperature territory for the satellite record.
Of course, everyone likely knows by now that the big news of late has been the v4 update to the RSS satellite data set, which raised the trend in their data by about 60%. Currently I've been working with the lower troposphere data (TLT) and the RSS update so far is only for the TMT and TTT data. I haven't heard otherwise, but I'm assuming an update for TLT will also be coming.
Given that February was such a huge jump relative to January in the GISS data and the surface station data seems to lead the satellite data in response to El Ninos, I think we're likely in for at least a few more very interesting months. This phase of the temperature trend is probably going to continue on at least through the NH summer and into the NH fall.
Buckle your seat belts. This is where the ride starts getting interesting.
Posted by Rob Honeycutt on Wednesday, 16 March, 2016
 |
The Skeptical Science website by Skeptical Science is licensed under a Creative Commons Attribution 3.0 Unported License. |