This article was originally published online at Corporate Knights Magazine and will appear in the publication's Fall 2016 hard-copy magazine.
Climate scientists are certain that human-caused emissions have increased carbon dioxide in the atmosphere by 44 per cent since the Industrial Revolution. Very few of them dispute that this has already caused average global temperatures to rise roughly 1 degree. Accompanying the warming is disruption to weather patterns, rising sea levels and increased ocean acidity. There is no doubt that further emissions will only make matters worse, possibly much worse. In a nutshell, that is the settled science on human-caused climate change.
What scientists cannot yet pin down is exactly how much warming we will get in the future. They do not know with precision how much a given quantity of emissions will lead to increased concentrations of greenhouse gases in the atmosphere. For climate impact it is the concentrations that matter, not the emissions. Up until now, 29 per cent of human emissions of carbon dioxide has been taken up by the oceans, 28 per cent has been absorbed by plant growth on land, and the remaining 43 per cent has accumulated in the atmosphere. Humans have increased carbon dioxide concentrations in the atmosphere from a pre-industrial level of 280 parts per million to over 400 today, a level not seen for millions of years.
There’s a possibility that the 43 per cent atmospheric fraction may increase as ocean and terrestrial carbon sinks start to become saturated. This means that a given amount of emissions will lead to a bigger increase in concentrations than we saw before. In addition, the warming climate may well provoke increased emissions from non-fossil fuel sources. For example, as permafrost thaws, the long-frozen organic matter contained within it rots and oxidizes, giving off greenhouse gases. Nature has given us a major helping hand, so far, by the oceans and plants taking up more than half of our added fossil carbon, but there’s no guarantee that it will continue to be so supportive forever. These so-called carbon-cycle feedbacks will play a big role in determining how our climate future will unfold, but they are not the largest unknown.
Atmospheric physicists have long tried to pin down a number to express what they refer to as climate sensitivity, the amount of warming we will get from a certain increase in concentration of greenhouse gases. Usually, this is expressed as the average global warming, measured in degrees Celsius that results from a doubling of carbon dioxide concentrations. The problem is not so much being able to calculate how much warming the doubling of the carbon dioxide alone will cause – that is relatively easy to estimate and is about 1 degree C. The big challenge is in figuring out the range of size of the feedbacks. These are the phenomena that arise from warming temperatures and that amplify or dampen the direct effects of the greenhouse gases that humans have added to the atmosphere.
The biggest feedback is water vapour, which is actually the most important single greenhouse gas in the atmosphere. Warm air holds more water vapour. As carbon dioxide increases and the air warms, there is plenty of water on land and in the sea available to evaporate. The increased amount of vapour in the air, in turn, provokes more warming and increased evaporation. If temperatures go down, the water vapour condenses and precipitates out of the atmosphere as rain and snow. Water vapour goes quickly into and out of the air as temperatures rise and fall, but the level of carbon dioxide stays around for centuries, which is why water vapour is considered a feedback and not a forcing agent. Roughly speaking, the water vapour feedback increases the sensitivity of carbon dioxide alone from 1 to 2 degrees C.
Another feedback results from the melting of sea ice in the Arctic. Ice reflects the sun’s energy back out into space, whereas oceans that are free of ice absorb more of the sun’s radiated heat. As warming temperatures melt the sea ice, the Earth absorbs more solar energy and the surface warms faster. The loss of sea ice is a major reason that Arctic temperatures are increasing about twice as fast as the rest of the globe. The Antarctic has gained rather than lost sea ice over recent decades due to the effects of ocean currents and other factors. But this gain is much smaller than the Arctic ice loss, so the overall effect of all polar sea ice on the climate is to amplify the global response to increased carbon dioxide concentrations.
The least well-defined feedback is the effect of clouds. The quantity and distribution of clouds is expected to change in a warming climate, but exactly how is not yet fully known and is debated. High clouds tend to keep more heat in, while low clouds tend to reflect more sunlight back into space, providing a cooling effect. Most experts estimate that clouds, on balance, will have anywhere from a slight cooling feedback to a significant warming feedback.
On top of the variance in the estimates of the feedbacks, the size of the human and natural factors that drive climate change, apart from carbon dioxide, also have a wide range. Greenhouse gases like methane play a big role in warming, while sulphate-particle pollution from coal-burning plants actually cools the planet by blocking the sun. Land-use changes – clearing forests, for example – also affect climate by either reflecting or absorbing more of the sun’s energy. Natural ejections of reflective particles from volcanoes can also influence the climate in significant, but unpredictable ways.
An early estimate of climate sensitivity was made in 1979 by the American scientist Jule Charney. He based his estimate on just two sets of climate calculations – or models – that were available at that time. One set of models predicted a sensitivity of 2 degrees, the other, 4 degrees, which he averaged to get a mean value of 3 degrees. Rather arbitrarily, he subtracted or added half a degree from the two model estimates to produce a minimum-to-maximum range of 1.5 to 4.5 degrees. Despite the shakiness of this approach, Charney’s estimate has proved remarkably durable.
The five Intergovernmental Panel on Climate Change (IPCC) reports produced between 1990 and 2013 drew upon the results of many more climate models that were also much more sophisticated. Nevertheless, all of the reports came up with estimates of the minimum, maximum and most likely sensitivities that were within half a degree of Charney’s rough estimate. In 2007, the fourth assessment report (AR4) provided a climate sensitivity range of 2 to 4.5 degrees C, with a most likely value of 3 degrees C. The latest report, AR5 in 2013, estimates the likely range of sensitivity at 1.5 to 4.5 degrees C, exactly the range Charney provided 34 years earlier with his educated guesswork.
It is worth noting that climate sensitivity is not an input factor into the climate models but a calculated result.
In the past few years, some scientists have made calculations based on recent temperature measurements and simple energy-balance climate models. This approach has tended to produce an estimate of a most-likely climate sensitivity number around 2 degrees, which is significantly lower than the previous best estimate of around 3 degrees from more complex climate models. Taking account of this work, the IPCC adjusted its lower estimates downward in the 2013 AR5 report and, because of the newly increased range, opted not to settle upon a most-likely central value. These new, lower values suggest that the average, complex climate models may be predicting too much warming.
However, a recent publication in the journal Nature Climate Change by NASA scientist Mark Richardson and his colleagues has exposed flaws in those simple, low sensitivity models. One problem is that the simple calculations took ocean temperatures measured just below the surface (which is the common measurement made by climate scientists) and compared them to the calculated air temperatures near the Earth’s surface that is output by climate models. Since air above the ocean warms more than the water, the comparison is not valid over the oceans. Richardson and his colleagues also factored in the effect of retreating Arctic sea ice on temperature measurements, and the lack of measured historical data in some regions. They then checked the calculations again, and as Richardson explained to Corporate Knights:
“Once you do a fair test then you get the same result from both the simple calculation using real-world data and from complex climate models. We took model water temperatures when the measurements are of water temperatures, and didn’t use model output when and where there were no measurements. This matters because fast-warming areas like the Arctic, where there is now less summer sea ice than in at least 1,450 years, have not historically been measured by thermometers. All of the effects combined in the same way; they hid warming. This is the main reason that climate models looked like they were warmed a bit too much since 1861.”
Additional recent research from a NASA team led by scientist Kate Marvel took a hard look at some other simplifying assumptions made in the low-sensitivity calculations. Marvel and her colleagues modified the inputs to more complex climate models to explore how much certain factors, like sulphate pollution or land-use changes, affected the climate when modelled in isolation. They found that these agents are more effective in causing temperature changes because they tend to be located in the northern hemisphere and on land where they carry a bigger punch than if it is simply assumed that their effect is distributed evenly across the planet, as some of the simpler, low-sensitivity studies have done.
Combining the Richardson and the Marvel results brings estimates of climate sensitivity back to, or even a little above Jule Charney’s estimates. To the non-specialist, all of this may seem like a rather pointless process where we end up where we started from, still stuck with a stubbornly wide range of a factor of 3 or so from minimum (1.5 degrees) to maximum (4.5 degrees). But as Gavin Schmidt, director of NASA’s Goddard Institute for Space Studies, told Scientific American last year: “We may be just as unsure as before, but we are unsure on a much more solid footing.”
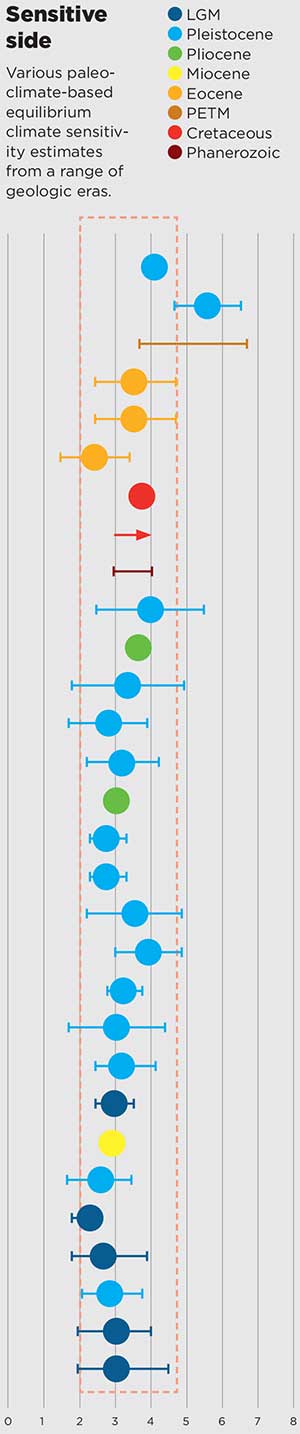
Climate sensitivity estimates are not just estimated by climate models using modern data. Scientists also have observations of how the Earth behaved in periods of past climatic change. From the ice-age cycles that occurred over the past 800,000 years there are samples of past atmospheres trapped in gas bubbles in ice cores that reveal the chemical mix of the air and the temperatures at the time.
Scientists can look back much further in time, many millions of years ago, when the Earth was in a hot-house state. In those times there was little ice even at the poles and sea levels were several tens of metres higher than they are today.
These observations of the geological past have their own considerable ranges of uncertainty, but, taken together, they produce estimates of climate sensitivity that are broadly consistent with the range calculated by climate models of the modern era. This consilience, which is to say, different approaches pointing to the same general result, explains why climate scientists are so confident that increasing concentrations of greenhouse gases lead to increased warming, even if nobody can yet be sure how much the human-induced warming will be over this century and beyond.
One thing we do know with great confidence is that if we continue to emit greenhouse gases at the current rate, then sometime in the second half of this century we will have doubled the concentration of carbon dioxide in the atmosphere. The last time concentrations were that high, 30 million years ago, there was no ice on Greenland and little on Antarctica.
Posted by Andy Skuce on Friday, 30 September, 2016
 |
The Skeptical Science website by Skeptical Science is licensed under a Creative Commons Attribution 3.0 Unported License. |