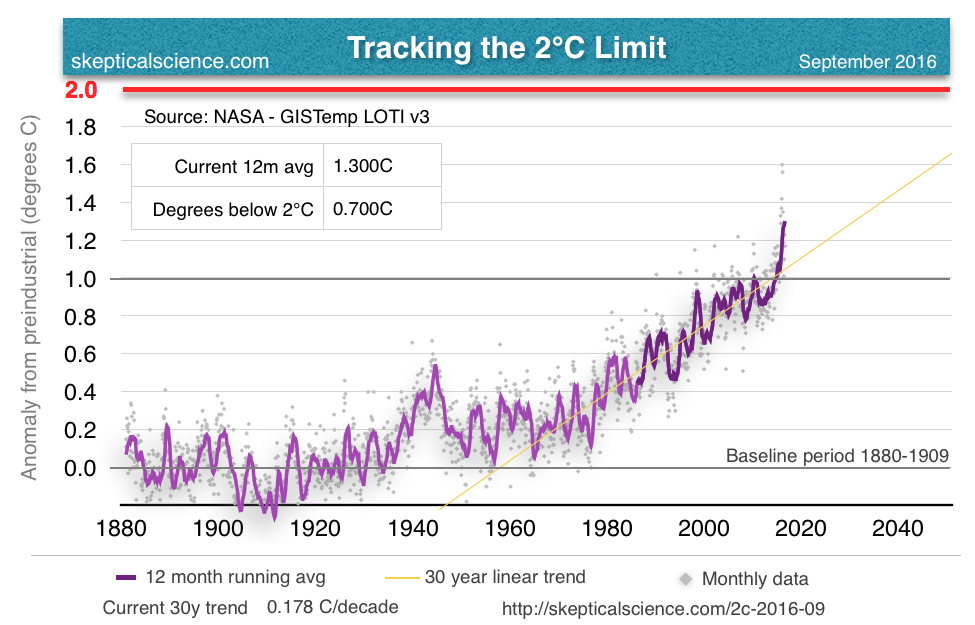
Septembers GISTemp data is now in so I can update the 2°C Limit chart. (Full page image here.) The Sept anomaly came in at 0.91°C, baselined to preindustrial that puts last month at 1.168°C.
Now that anomalies have dropped back down closer to the long term trend, the latest plots are hard to pick out. Here's September:
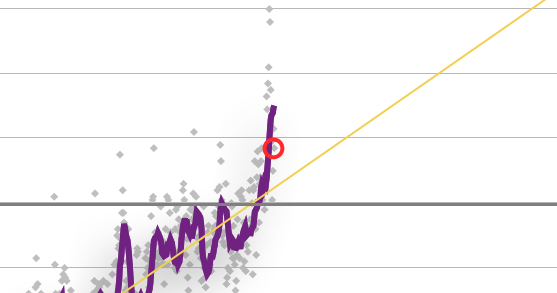
While the 30 year trend is still running at 0.178°C/decade, it's important to take a look at how dramatic the past 10 years have actually been.

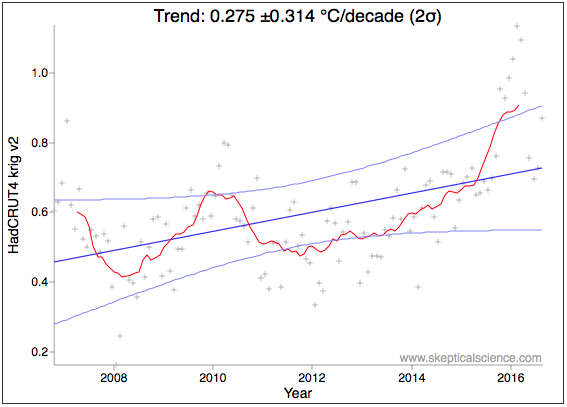
We see fairly similar results in the HadCRU data...
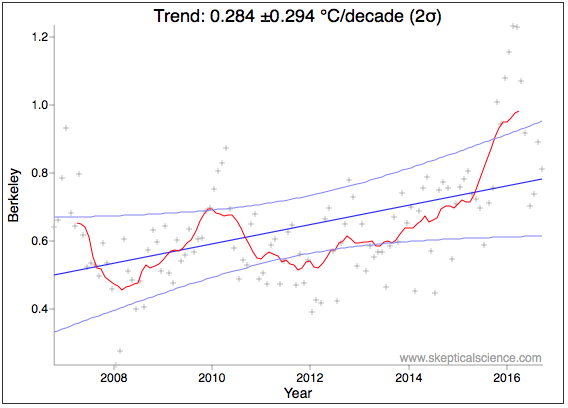
And in the BEST data...
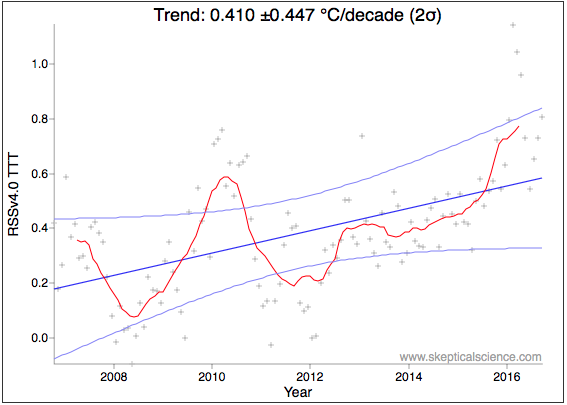
Now that we have RSS's v4 data, we can more reliably look at tropospheric temps as well. Note that I'm presenting the TTT data (total troposphere) which is probably the best representation of the troposphere over the TLT or TMT data.
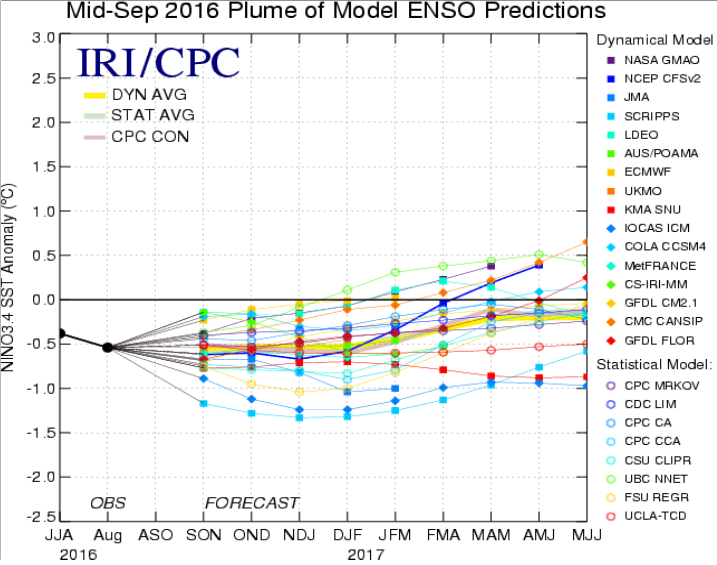
While the latest El Niño has continued to subside, models are suggesting we're not going to see a strong La Niña following it.
It would be a mistake to over-interpret all this to say this is the new normal for the temperature trend (~0.45°C/dec). Instead, I would be prone to characterize this as looking like we're firmly riding a riser on the trend escalator.
Posted by Rob Honeycutt on Wednesday, 26 October, 2016
 |
The Skeptical Science website by Skeptical Science is licensed under a Creative Commons Attribution 3.0 Unported License. |