Zeke Hausfather, Kevin Cowtan, David C. Clarke, Peter Jacobs, Mark Richardson, and Robert Rohde
In a paper published in Science Advances, we used data from buoys, satellites, and Argo floats to construct separate instrumentally homogenous sea surface temperature records of the past two decades. We compared them to the old NOAA ERSSTv3b record, the new ERSSTv4 record, the Hadley Centre’s HadSST3 record, and the Japanese COBE-SST record. We found a strong and significant cool bias in the old NOAA record, and a more modest (but still significant) cool bias in the Hadley and Japanese records compared to buoy, satellite, and Argo float data. The new NOAA record agrees quite well with these instrumentally homogenous records. This suggests that the new NOAA record is likely the most accurate sea surface temperature record in recent years, and should help resolve some of the criticism that accompanied the original NOAA study.
In the summer of 2015 researchers at NOAA led by Tom Karl published a paper in the journal Science arguing that global warming since 2000 had been underestimated, and that claims of a 'hiatus' in warming were therefore wrong. The paper proved quite controversial, and the chairman of the U.S. House of Representatives Science and Technology Committee responded by instigating an investigation against scientists at NOAA, demanding access to scientist emails and claiming that they had manipulated global temperature data.
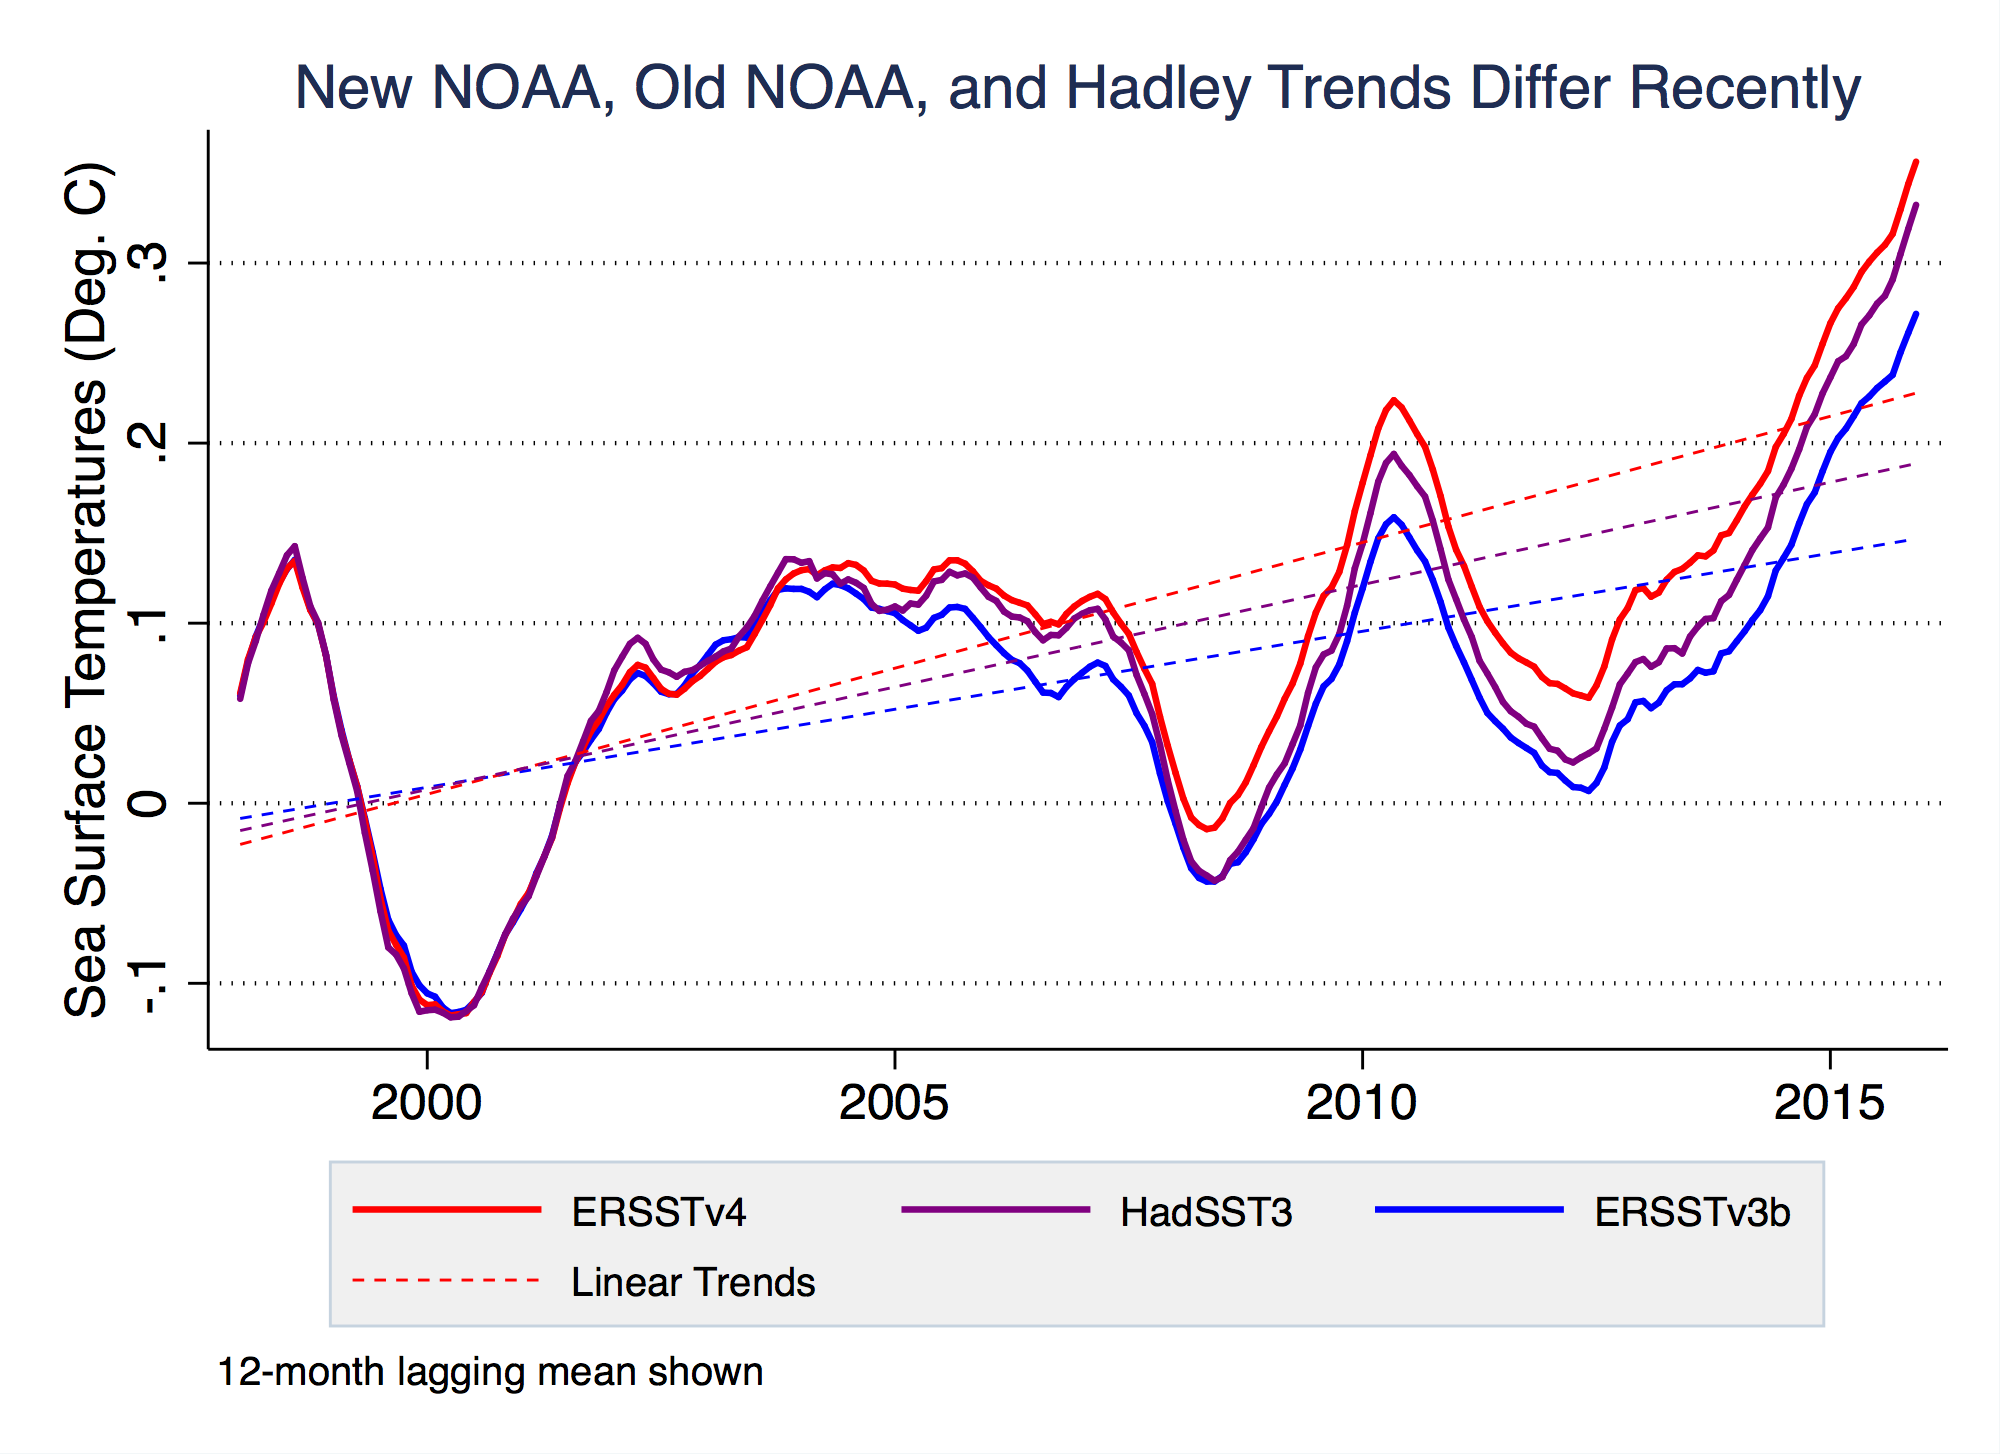
The changes in the global temperature record presented by Karl et al resulted almost entirely from updates in ocean temperatures. Specifically, NOAA switched from using their old Extended Reconstruction Sea Surface Temperature Record (ERSST) version 3b to version 4. This new ERSST record had a number of changes, including adjustments for an offset in temperatures between ship engine room and buoy-based measurements, the use of nighttime marine air temperature measurements to detect problems in ship-based records, and an increased weight on buoy records in recent years. The old NOAA record, their new record, and the commonly used U.K. Hadley Centre HadSST3 record are shown in the figure below:

The new NOAA record shows nearly twice the warming over the past 18 years than the old NOAA record, and shows little evidence of any apparent “pause” or “hiatus”. It also shows significantly more warming than the Hadley Centre’s HadSST3 record. Both the new NOAA record and the Hadley record correct for the temperature offset due to the transition from ships to buoys (ship engine rooms are warm, and water piped into the engine room before the temperature is measured tends to be around 0.1°C warmer than water measured directly on the ocean surface by buoys), so other factors must be responsible for the difference between the two records.
Both Hadley and NOAA (as well as the Japanese COBE-SST record) are what we call composite records. That is, they try and take data from multiple different types of instruments that are changing over time and combine them in a single long-term climate record. This poses challenges when the way measurements taken change (e.g. switching from buckets thrown over the side of ships to engine room intake valves, or more recently from ships to buoys) and requires some judgment calls of how to calibrate each set of data and correct for any biases.
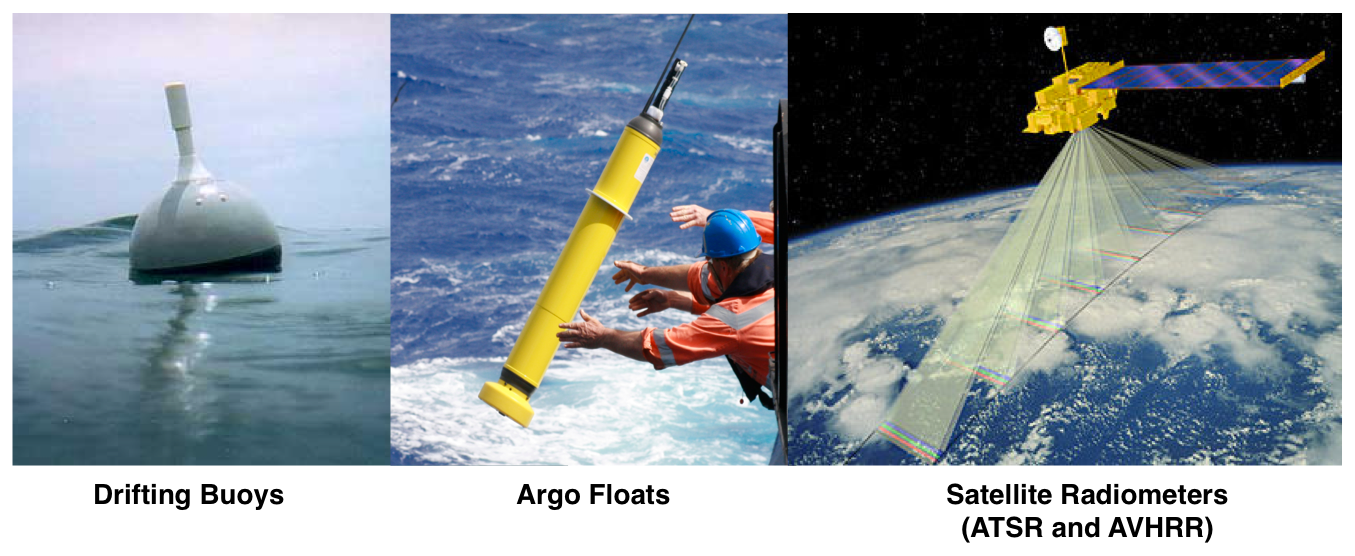
Thankfully, data exists that allows us to determine what is driving these differences and which of the three records is closest to the truth. Over the last two decades we have a wealth of measurements available of ocean temperatures, including data from buoys, satellite radiometers, and Argo floats. We use these to construct what we term Instrumentally Homogenous Sea Surface Temperature records; that is, records created only from one type of instrument: only from buoys, only from satellites, and only from Argo floats. These instrumentally homogenous records have the benefit of requiring little adjustments or calibrations, as they all come from the same type of instrument.
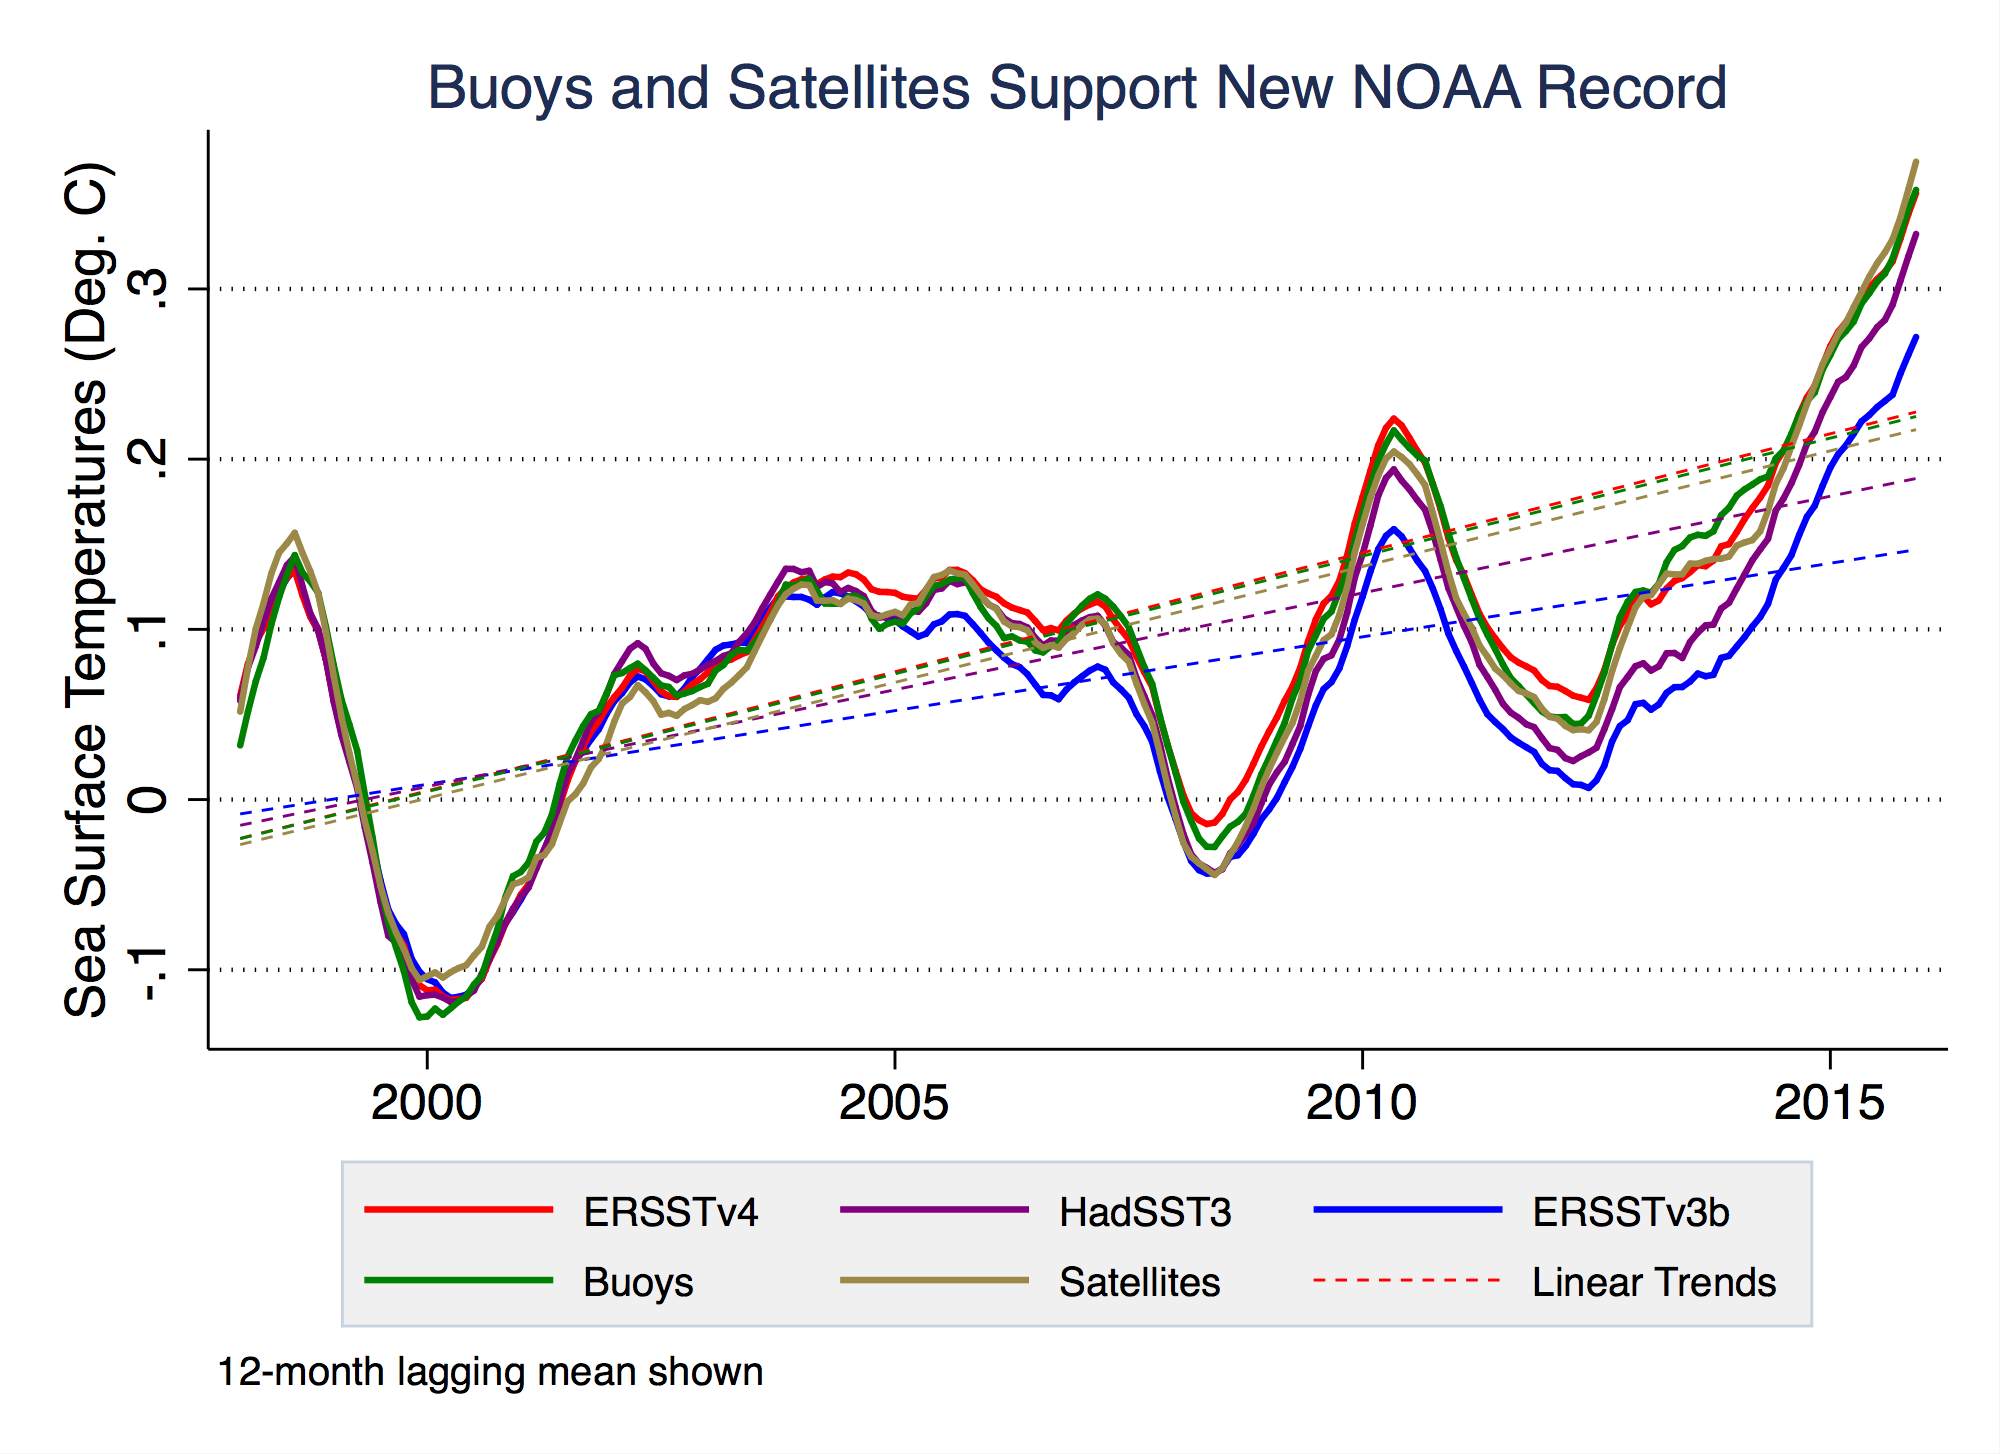
The buoy-only and satellite-only records we use span the period from 1997 to the end of 2015. Over that period their global average sea surface temperature records agree nearly perfectly with the new NOAA record, and show a strong cool bias in the old NOAA record and a more modest (but still significant) bias in the Hadley record:
We can also see this if we look at the trends in the differences between buoy, satellite, Argo records and the four composite sea surface temperature records (old NOAA ERSST v3b, new ERSST v4, Hadley’s HadSST3, and the Japanese COBE-SST). In the figure below a value of zero means that the instrumentally homogenous record agrees with the composite record; a value below zero means that the composite record has a cool bias:
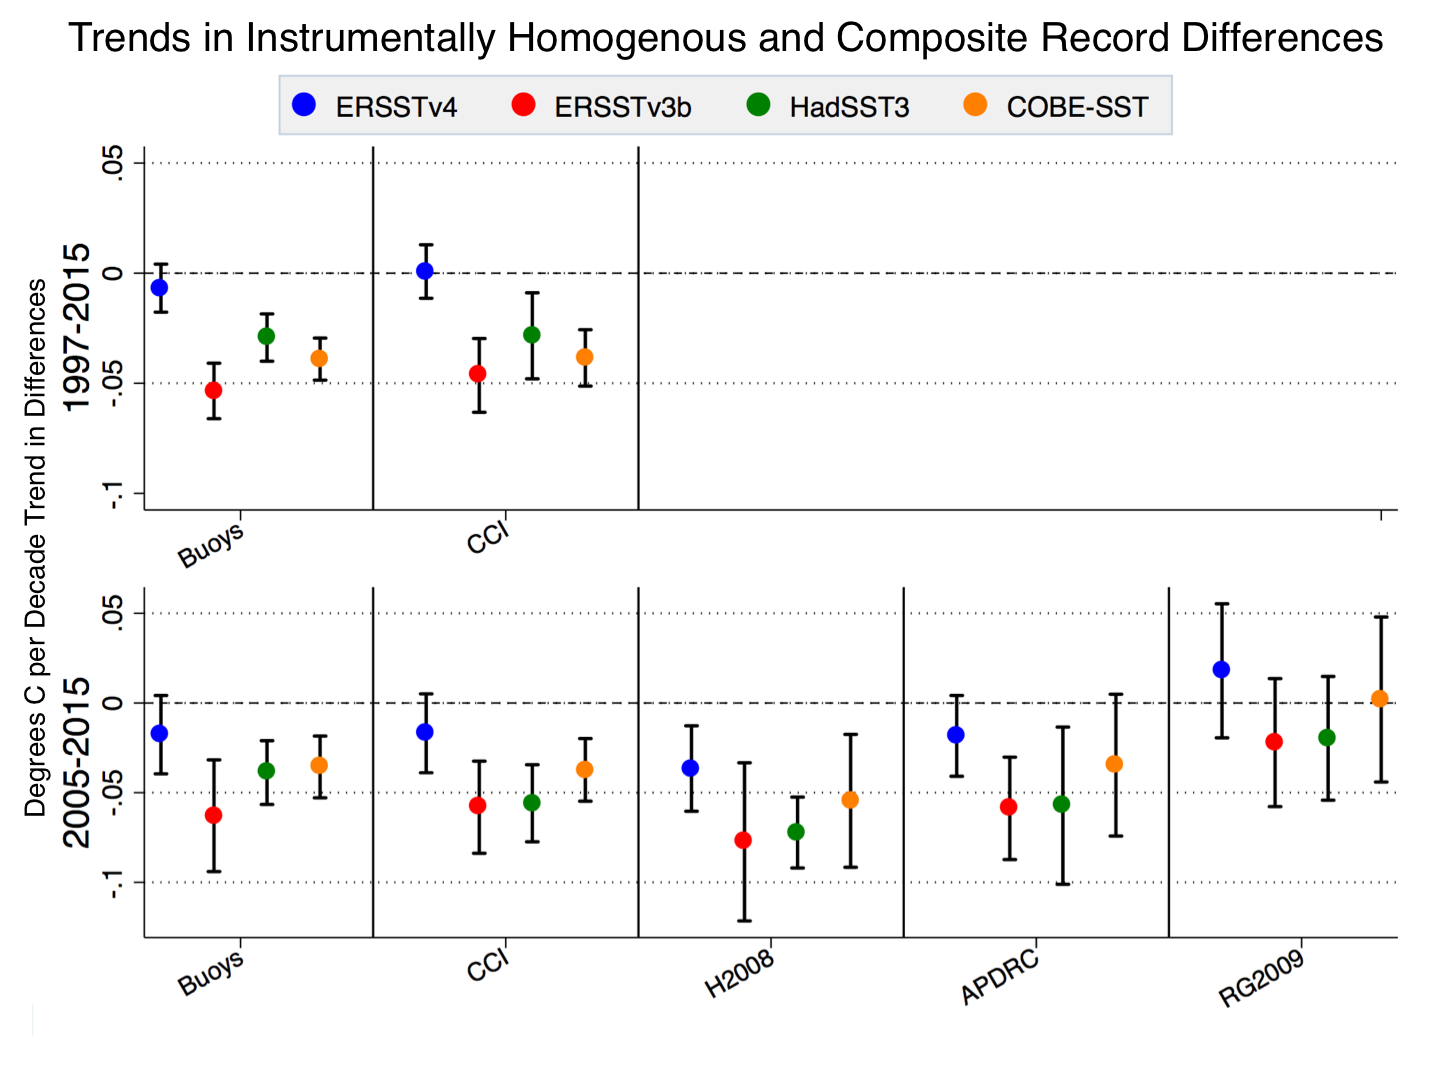
From 1997-2015 buoys and satellites (CCI) both agree quite well with the new NOAA record and show a significant cool bias in the other composite records. From 2005-2015 (when the Argo data is available), buoys, CCI, and two of the three Argo-based records examined (H2008 and APDRC) either agree with the new NOAA record or show a slight cool bias in the new NOAA record, and show cool biases in the other three composite records. The third Argo-based record examined, RG2009, has more ambiguous results.
About half of the difference between the old and new NOAA records can be explained by the inclusion of an adjustment for the temperature differences between ship engine room and buoy measurements. Hadley, which includes this adjustment, has a trend about half way in between the old and new NOAA records. However, Hadley weights ships and buoys equally in their reconstruction, while NOAA assumes that buoys are more accurate and gives them more weight when they are in the same area as ship records. It turns out that buoys and ships both have an absolute offset in measured temperature and show warming at different rates. The figure below shows the buoy-only record in green and a record using only data from ships in red:
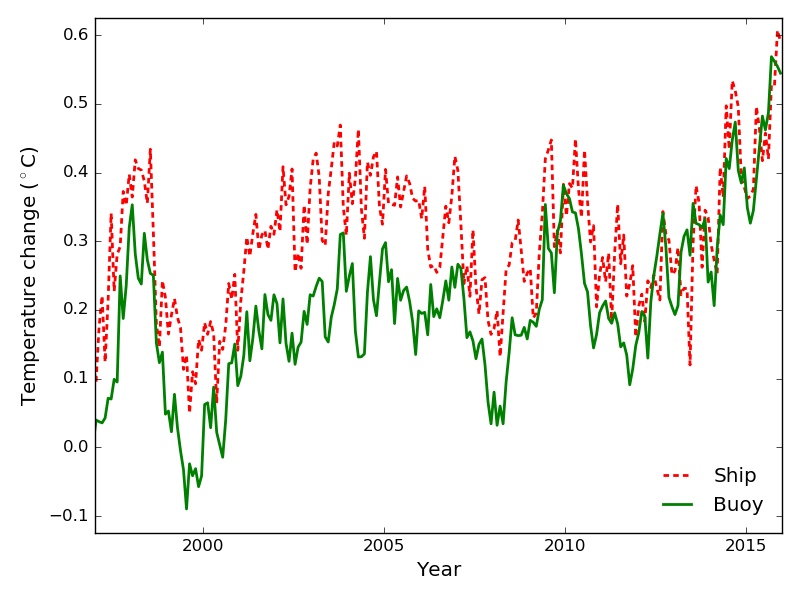
While buoys all use the same instrument type and are largely unchanged over the past two decades (apart from more buoys being deployed), the same is not true for ship-based measurements. The depth of the hull, the speed of ships, and the type of ships have all changed over the past two decades. The number of ship measurements have also fallen by about a third over this period. Theses changes appear to have introduced a spurious cool bias in the ship records that impacts Hadley’s record, but that the new NOAA record mostly avoids by putting more weight on the higher quality (and more homogenous) buoy record.
Here we undertook an effort to independently evaluate the new NOAA ERSSTv4 sea surface temperature record using data from buoys, satellites, and Argo floats. We found that NOAA’s new record effectively corrects a significant cooling bias present in their old record during the past two decades without introducing any detectable residual trend bias. We also concluded that two other widely used composite SST series, HadSST3 and COBE-SST, likely suffer from spurious cooling biases present in ship-based records in recent years. Overall, these new instrumentally homogenous results support the view that the updated NOAA record is the most accurate composite estimate of global SST trends during the past two decades. Consequently, our work reinforces previous findings that the rate of recent warming had been underestimated.
Posted by Zeke Hausfather on Thursday, 5 January, 2017
 |
The Skeptical Science website by Skeptical Science is licensed under a Creative Commons Attribution 3.0 Unported License. |