As humans emit heat-trapping gases like carbon dioxide, the planet warms, and over time consequences become more apparent. Some of the consequences we are familiar with – for instance, rising temperatures, melting ice, and rising sea levels. Scientists certainly want to know how much the Earth has changed, but we also want to know how fast the changes will be in the future to know what the next generations will experience.
One of the classic projections into the future is for sea level rise. It is expected that by the year 2100, the ocean levels will rise a few feet by the end of the century. This matters a lot because globally, 150 million people live within three feet of current ocean levels. We have built our modern infrastructure based on current ocean levels. What happens to peoples’ homes and infrastructure when the waters rise?
But projecting ocean levels into the future is not simple; we need good data that extends back decades to understand how fast the climate is changing. The classic way to measure ocean levels is by using tide gauges. These are placed just offshore, around the globe to get a sense of how the ocean levels are changing. The problem with tide gauges is they only measure water levels at their location, and their locations are always near shore.
In order to get a better sense of how oceans are changing everywhere, a complementary technology called satellite altimetry is used. Basically, the satellites shoot a radar beam from space to the ocean surface and watch for the reflection of the beam back to space. From this beam, the satellite can calculate the height of the water. Satellites can emit beams continuously as the satellite passes over open oceans, and can gather data far from shorelines. In doing so, they provide the equivalent of a global network of nearly half a million tide gauges, providing sea surface height information every 10 days for over 25 years.
Just recently, in the Proceedings of the National Academy of Sciences, a paper has been published that collects all the available satellite altimetry data and asks whether the sea level rise is accelerating. The authors of the paper are a well-respected team and include Dr. Steven Nerem from the Cooperative Institute for Research in Environmental Sciences (CIRES) and Dr. John Fasullo, from the National Center for Atmospheric Research.
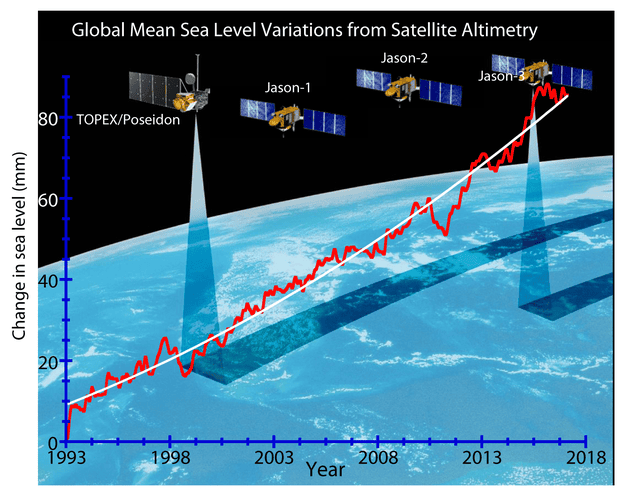
The authors collected data from four generations of satellites that have carried out this altimetry task. The most recent satellite is called Jason 3, launched in 2016. The satellites generate the data shown below. While in any given year ocean levels may rise a bit or fall a bit, the authors focused on the long-term trend (the white line). They found that the long-term trend is, indeed, accelerating. The rate of acceleration is approximately 0.084 mm per year per year. That may not sound like much, but were this rate of acceleration to continue (a conservative estimate), the authors project that by the end of the century oceans with rise approximately 65 cm (more than two feet).

Satellite altimetry data. Illustration: John Fasullo
In the study, the authors quantified what was causing the ocean waters to rise. Part of the rise is related to what’s called thermal expansion (warmer water is less dense so it expands). In the past, this was responsible for the majority of sea level rise. More recently, however, melting ice has contributed more and more to sea level rise. As land-based ice melts, the liquid water flows into the oceans and increases the mass of water in the oceans.
The two largest ice sheets (also the two largest contributors to sea level rise) are found on Greenland and Antarctica. There are other sources of melting ice, such as mountain-top glaciers that also are contributing, but the lion’s share of melting contribution is from the Greenland and Antarctica ice sheets.
Is this acceleration very important?
Posted by John Abraham on Tuesday, 27 February, 2018
 |
The Skeptical Science website by Skeptical Science is licensed under a Creative Commons Attribution 3.0 Unported License. |