
How have we measured the temperature of the ocean’s upper layer in the last 150 years? How does understanding physical processes and observational errors help to standardise climate data and understand climate change?
Figure 1: Convective clouds over the Western Pacific. Source: NOAA.
In the tropical atmosphere, tall clouds such as those shown in Figure 1 are governed by sea surface temperature, and one of the surprising hypotheses of climate change (known as the Thermostat Hypothesis) states that they, in turn, limit the maximum temperatures above the ocean by reflecting sunlight. These kinds of feedback loops between ocean temperature and other meteorological and oceanographic features, such as clouds, atmospheric circulation, ocean currents, and precipitation, are the reason why measuring sea surface temperature is an important element of today’s climate-change debate.
Sea surface temperature (SST) is also one of the climate indices with the longest histories of direct measurements. Because ocean makes up about 70% of the total Earth’s surface, changes in the temperature of its surface are a key factor for determining the global temperature of the planet’s surface.
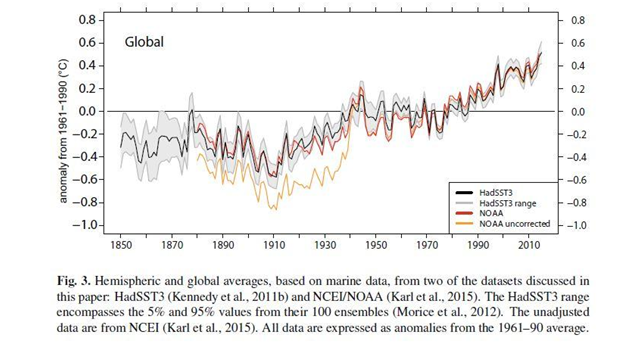
Figure 2: Global changes in sea surface temperature based on two different climate databases, which only use temperature measurements above the ocean. The data are expressed as deviations from the 1961–1990 average. Source: Jones, 2016.
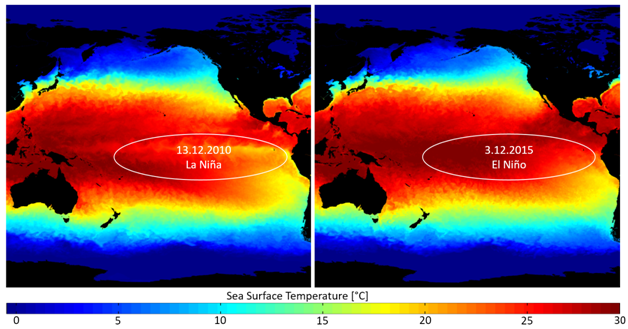
Figure 3: Global sea-surface temperature distribution on 13 December 2010 (La Niña) and on 3 December 2015 (El Niño). The data are based on the measurements using the following instruments: Advanced Very High Resolution Radiometer (AVHRR), Moderate Imaging Spectroradiometer (MODIS), and Terra and Aqua and Advanced Microwave Spectroradiometer-EOS (AMSR-E). Source: PODAAC.
Sea surface temperature is also important in forecasting many atmospheric phenomena. Figure 3 shows the sea surface temperature distribution in December 2010 and in December 2015. There are visible differences on the Pacific between these two years.
The late 2010 – early 2011 season (on the left) was a period of La Niña, and the late 2015 – early 2016 season (on the right) was a period of a strong El Niño. During El Niño, the water temperature off the coast of South America is higher than during La Niña. Not only does it influence precipitation in South America, but it also affects the weather in the middle latitudes.
The occurrence of El Niño or La Niña can be diagnosed by indices based on the measurements of the ocean’s upper layer temperature.
Many details of oceanic flows are visible in the satellite images of sea surface temperature. In Figure 4, you can see large areas of warm water in the western Pacific and in the eastern Indian Ocean, which lead to high precipitation in Indonesia. In the eastern Pacific, a narrow swath of lower temperatures is marked as a “Cold tongue.” This is where the so-called Tropical Instability Waves develop.
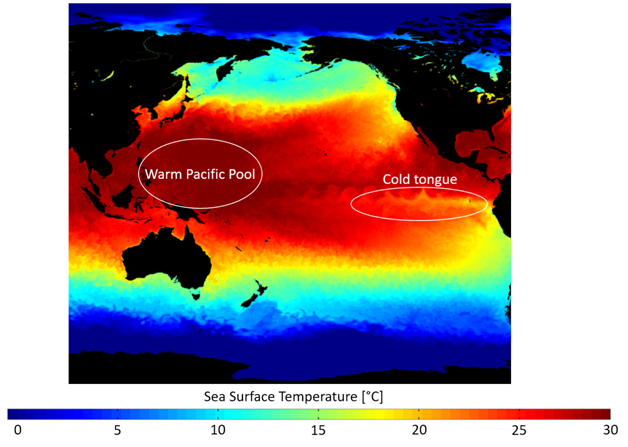
Figure 4: 24 August 2014. A huge pool of warm water is visible in the western Pacific. In the eastern Pacific, the “Cold tongue” of lower sea surface temperature and the developing disturbances known as the Tropical Instability Waves can be seen. Source: PODAAC.
Figure 5 shows the northern area of the Atlantic. In the blue frame, you can see the Gulf Stream, which carries warm water from the subtropics northwards, and then towards Europe, causing European winters to be warmer than in other areas on similar latitudes.
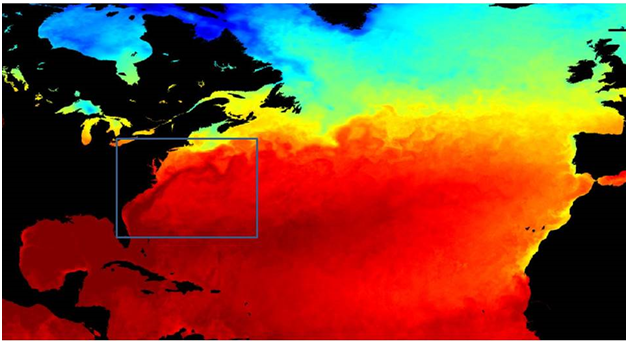
Figure 5: Sea surface temperature on 24 August 2014. In the blue frame, you can see the meandering Gulf Stream.
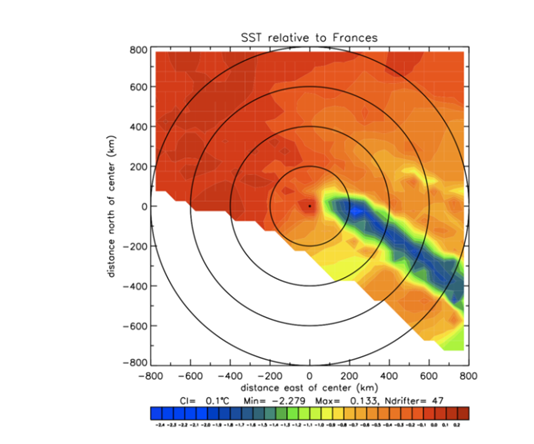
Figure 6: Sea surface temperature around the eye of hurricane Frances. You can see the “cold trail” left by the hurricane. Source: Pearn Niiler, UCSD.
Measuring the ocean’s upper layer temperature is also important in forecasting tropical cyclones. In Figure 6, which shows the sea surface temperature distribution around the eye of hurricane Frances, you can see that the eye moves towards warmer areas, leaving a “cold trail” behind. The existence of such trails means that hurricanes draw a lot of their energy from the ocean, and then convert it to kinetic energy of the winds through condensation of water vapour. A warm anomaly of sea surface temperature under a moving storm can cause it to rapidly intensify. It is also possible (although still largely up for debate) that the rise of ocean temperatures caused by global warming can increase the number and the intensity of hurricanes in a warming climate.
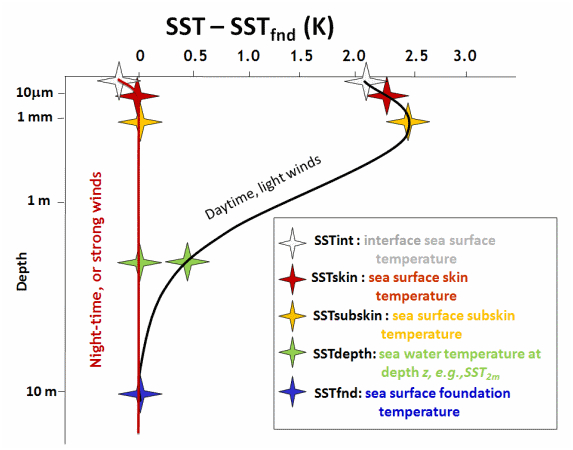
Figure 7: Definitions of different sea surface temperatures. SSTskin is measured in infrared, SSTsub-skin is measured in microwaves. Source: GHRRST.
But what exactly is sea-surface temperature? Before we move on to the measurement techniques, let us have a look at Figure 7, which illustrates the vertical profile of temperature in the ocean’s upper layer, up to a depth of around 10 metres (foundation depth). Figure 7 shows typical night-time and daytime temperature distributions. This “foundation” sea-surface temperature, marked with a blue star, is usually observed throughout the entire layer by the end of the night, and it is the parameter used to express the changes in sea-surface temperature.
However, as shown in Fig. 7, there are “different” sea surface temperatures, which depend on the measurement depth. At the interface of air and ocean, a white star marks SSTint temperature. It is usually a little lower than the temperature of the water directly beneath it. This is because energy is emitted through infrared radiation. SSTint is the temperature that would be observed at the very surface of the water, but its definition has mostly theoretical importance, because it is impossible to directly measure the temperature at this interface.
The red and yellow stars mark the sea surface temperatures measured at around 10 micrometres (for comparison, a human hair is about 60 micrometres thick) and a couple of millimetres from the air-water interface. It turns out that infrared electromagnetic radiation only penetrates the ocean to a very small depth. Microwave radiation reaches slightly deeper, up to a few millimetres. Water temperatures measured at these depths are called skin and subskin sea surface temperatures, or skin sea-surface temperatures with regard to infrared and to microwave radiation. They can be indirectly calculated based on satellite measurements.
The green star represents sea-surface temperature as observed at a given depth. It can be measured, for example, using a bucket, a scoop, drifting buoys or water drawn from overboard to cool a ship’s engine. As measurements can be taken at different depths, it is generally denoted by SST with added information about the depth of measurement, e.g. SST(18cm).
Sea surface temperature changes when the upper layer of the ocean absorbs sunlight. This leads to diurnal temperature variations: a warm layer is formed during the day, and usually disappears at the end of the night. The vertical profile of this warm layer is not yet thoroughly understood. Its structure depends on how transparent water is, which is linked to the amount of phytoplankton, the wind speeds at the ocean’s surface and the vertical flow of water. All throughout the night and day, energy is radiated from the ocean surface in infrared. Temperature is also governed by water evaporation.
In the last couple of years, all methods of measurement are being reduced to determine the foundation sea surface temperature as defined above. In other words, no matter what measurement techniques were used or when the observations were performed, we try to introduce systematic corrections so that all measurements have the same point of reference. In practice, these systematic corrections are sometimes very hard to implement, especially if the measurements were performed a few dozen years ago.
Buckets tied to ropes would be thrown off a ship, then pulled back up (Figure 8). Next, thermometers would be put inside the buckets to measure the water’s temperature. This is how measurements of sea surface temperature began around 150 years ago. The decision to start such measurements had been made during the International Maritime Conference in 1853, mainly to improve the security of marine navigation. They were performed by voluntary observing ships during their regular voyages. As it turns out, it is currently the longest-running measurement series available to assess the changes in Earth’s surface temperature.
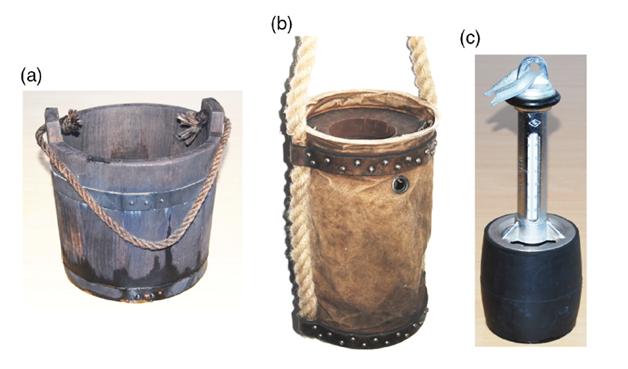
Figure 8: A wooden bucket, a canvas bucket and a modern German scoop [Carella 2017].
Other climate data and methods of evaluating changes in temperature are based on paleoclimatic indices, that is information coming not from direct measurements, but from indirect assessments or numeric models. Thermometers in water buckets offer direct measurements, which is why they are so important.
Although a measurement protocol known as “the Abstract Log” had been in place since 1853, many different techniques were still used afterwards, making it difficult to standardise the results today. Measurement techniques have evolved during the 150 years – wooden buckets have been replaced by canvas and rubber buckets, then we measured the temperature of water used to cool the engine, since 1971 we used moored buoys, and since 1978 we also used buoys drifting on the surface of the ocean. Today we also commonly use satellite measurements. At times, external circumstances changed – during WWII European ships rarely performed measurements, so most of the data comes from American vessels. Furthermore, no one measured temperature during the night, so as not to reveal the ship’s position.
What happens to water in a bucket after pulling it on board a ship? During the day, the Sun shines on the bucket and wind causes evaporation. The material of which the bucket is built causes water temperature to change faster or slower, depending on air temperature. Scientists have used various techniques to estimate the changes in the temperature of water in a bucket standing on board a ship. One such method is a laboratory measurement (Figure 9). The results of such a procedure can be expressed through mathematical expressions that account for factors such as incoming solar radiation, loss of energy through infrared radiation, size and material of the bucket, wind speed, water mixing, and the initial difference of temperature and humidity between air and water. For example (Figure 10), if a measurement was performed 3 minutes after pulling the bucket up, and water was 5°C warmer than air, it would cool down by 0.2°C – in other words, the reports systematically understate sea surface temperature. This “cold error” is now taken into account through correction of sea surface temperature measurements, which is one of the methods of standardising climate data.
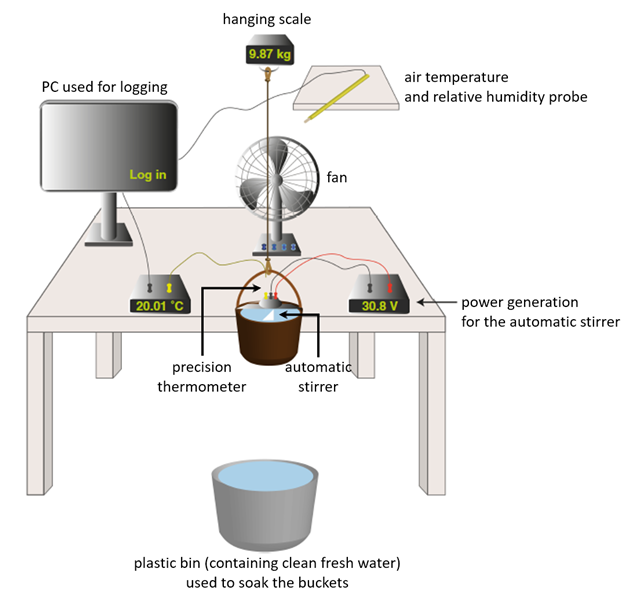
Figure 9: Illustration of experimental measurements to assess temperature change inside various buckets and scoops. The procedure uses precision thermometers to measure air and water temperature, a ventilator and an automatic stirrer (Carella et al., 2017).
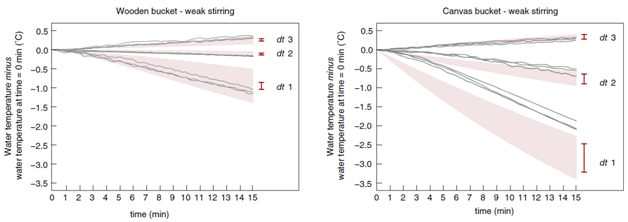
Figure 10: Measured water temperature (black, continuous line) vs. time and initial temperature difference between air and water. Case d1: water temperature is 5°C higher than air temperature; d2: water about 1°C colder than surrounding air; d3: water 5°C colder than air. Only results for weak stirring are presented. Wind speed is 3.5 m/s. Shading indicates model results. Source: Carella 2017.
If you throw a ball in a river, it will go downstream. In the late 1970s, the first buoys were built and deployed to drift in the ocean. Drifters, as they are called, consist of a sphere, inside of which there is equipment to measure temperature, batteries and a system that enables communication with satellites passing above. Based on the position obtained from a GPS receiver, the buoy’s speed and direction of movement can be determined, and satellite data transmission allows us to estimate sea surface temperature at a depth of around 18 centimetres below the air-water interface.
A typical buoy is about 40 centimetres across, and is tethered to something that resembles a “holey sock,” a 7-metre-long cylinder that limits the drift to the velocities and directions of water currents around 15 metres below the ocean’s surface. A large number of drifters released into the ocean approximately 500 kilometres apart can help to gauge sea surface temperature over vast areas.
In the last two decades, we had about 1300 buoys drifting on the ocean’s surface. Some of them provide information not only about ocean currents and water temperature, but also about surface pressure and/or water salinity. Sometimes drifters are deployed before tropical cyclones to measure the hurricane’s cold trail, that is the decrease in water temperature caused by the interaction between the ocean and the atmospheric circulation in the cyclone.
The fact that buoys drift, shoved by wind and ocean currents, is in itself not good for global temperature measurements, because after some time drifters tend to end up on a shore or close together. For this reason, a few dozen new drifters are deployed every year. In measuring temperature, drifters typically use a small sensor – an epoxy-coated thermistor in a steel tube that sticks out from the spherical buoy casing close to the bottom. The precision of such measurements is around 0.1°C, but because drifters spend a couple of years in the ocean, there may occur systematic variations of absolute temperature reported by thermometers. However, they are usually relatively minor. Surface buoys are an important source of global sea-surface temperature measurements, because they may be deployed virtually anywhere, as opposed to ship-based measurements, which are generally performed on the sea routes between economically important regions.
We should stop to think about what exactly “global temperature measurements” are. On land, temperature measurement stations are placed about 300 kilometres apart, and measurements are performed at so-called synoptic hours – simultaneously throughout the world. The word “synoptic” derives from Greek words meaning “together with” and “view,” which is why in oceanography and meteorology, it means simultaneous measurements. Due to the vastness of the global oceans, taking simultaneous measurements every 300 kilometres has always been difficult. Drifters allowed us to obtain a more “synoptic” and global image of water temperature.
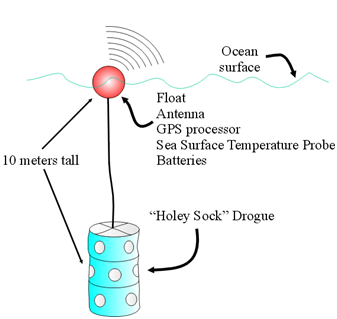
Figure 11: Drifter – drifting buoy with a “holey sock.” Source: University of Alaska.
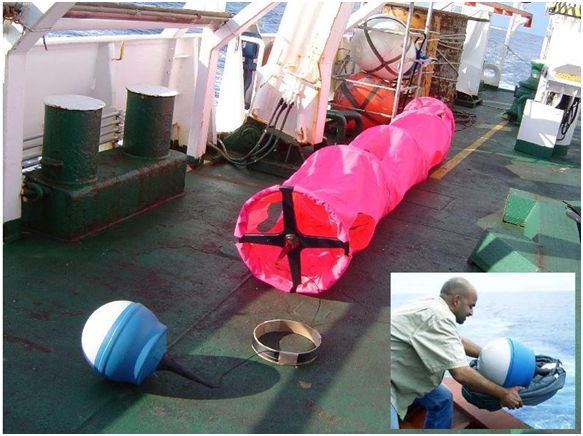
Figure 12: Drifting buoy (white-and-blue) with a red “sock.”
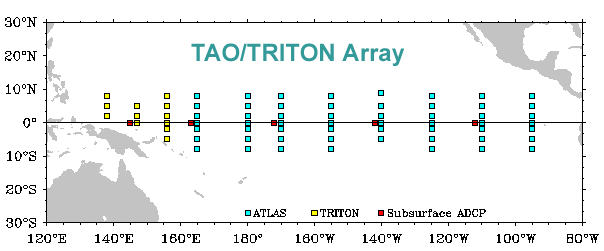
Figure 13: Drifting and moored buoy distribution in July 2017. Source: JCOMMOPS.
One of the most important achievements of the last two decades was to establish a measurement array of moored buoys (see Figure 14) throughout the equatorial regions of the Pacific, the Indian Ocean and the Atlantic (TAO/TRITON, RAMA and PIRATA). They are used not only to measure sea surface temperature, but also for measurements below the surface and for atmospheric measurements. The buoys are deployed on various latitudes between 10° S and 10° N. Moored buoys play an important role in satellite instrument calibration. On the other hand, they require relatively frequent and expensive maintenance. A ship needs to visit them every dozen or so months to replace the instruments. Due to these costs, the future of this network is currently uncertain.
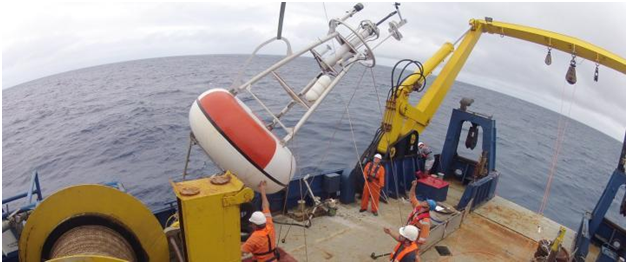
Figure 14: Photograph of a buoy used in the TAO array in the equatorial Pacific. Source: PMEL.
Figure 15: Map of the TAO array of moored buoys in the Pacific. Source: PMEL.
In the second part of the article, you will read about the specificity of satellite measurements and about a system of autonomous submerging measurement buoys. See you next time!
The original article was written by Piotr J. Flatau from the University of California San Diego (UCSD) for our Polish partner site Nauka o Klimacie and Juliusz P. Braun translated it into English. You can access the original article by clicking on the logo:![]()
Posted by Irek Zawadzki on Tuesday, 10 July, 2018
 |
The Skeptical Science website by Skeptical Science is licensed under a Creative Commons Attribution 3.0 Unported License. |