Two recently published peer-reviewed studies make clear that the planet’s oceans are continuing to set hottest-yet temperature records nearly every year and, secondly, that the rate of ocean warming is in virtual lockstep with what modern climate models have projected.
Taken together, the findings, from studies led by Lijing Cheng of the Chinese Academy of Sciences Institute for Atmospheric Physics, demonstrate that climate scientists have developed an increasingly clear picture of the rapid warming of Earth’s oceans and its consequences.
One study, led by Cheng and colleagues and published in Advances in Atmospheric Sciences, concludes that 2018 was the hottest year ever recorded in the oceans. In fact, since the turn of the century, all but three years – 2007, 2010, and 2016 – have set a new ocean heat record.
Those three exceptions shared a key trait: Each was characterized by significant El Niño events, which transfer heat from the ocean to the air. As a result, for heat at Earth’s surface (in the air above both the land and oceans), 2007 was the second-hottest year up to that time, and 2010 and 2016 both subsequently broke the surface temperature record. 2018 was the fourth-hottest on record at the surface as a result of a La Niña event that year that kept more heat in the oceans than was the case in 2015 through 2017.
About 93 percent of global warming goes into heating the oceans, compared to about 2 percent warming the atmosphere. As the hottest year in the oceans, 2018 therefore was the hottest year ever recorded for the planet as a whole. And the amount of heat currently building up on Earth is equivalent to the amount of energy released by more than five atomic bomb detonations per second, every second.
What’s it all mean? Because humans live on Earth’s surface, it’s only natural that we focus primarily on the air temperatures that we experience most directly. But most of the heat trapped by the tens of billions of tons of greenhouse gases released into the atmosphere each year is absorbed by the oceans; it’s there that El Niño and La Niña events exert significant influence over the amount of heat transferred each year to the air. As a result, surface temperatures are quite variable, and the public at large can mistakenly focus on short-term surface warming changesand lose sight of the big picture: The heat has to go somewhere, and Earth overall is regularly breaking temperature records in the oceans, in the air, or in both … and doing so almost every year.
In the second paper, published in Science, a team of researchers led by Cheng compared the most recent measurements of ocean warming to model projections. In the most recent IPCC report, published five years ago, while ocean heat estimates fell within the range of model projections, the observational data between 1971 and 2010 was warming about 25 to 40 percent more slowly than the model average. However, ocean heat content data have become more accurate since the publication of that IPCC report. Scientists now have more data from Argo floats, thousands of which have been deployed around the world’s oceans in the years since 2003.
Prior to the deployment of those Argo floats, ocean heat measurements were made less frequently, primarily using “expendable bathythermographs” (XBTs) – a temperature probe connected by wire to a ship. The probe sinks down into the ocean, transmitting data until the wire runs out and the probe falls to the ocean floor. Because of challenges and dangers associated with monitoring and retrieving bathythermographs from ships during bad weather, scientists have invented expendable versions. One key challenge is that XBTs don’t measure the depth at which they’re recording temperatures, meaning that using XBTs to estimate ocean temperatures requires making assumptions about their rate of movement. As the study authors note, “Differing corrections to XBT measurements, as well as different approaches to infilling regions where data is sparse, have led to large differences in [ocean heat content] estimates prior to the Argo era.”
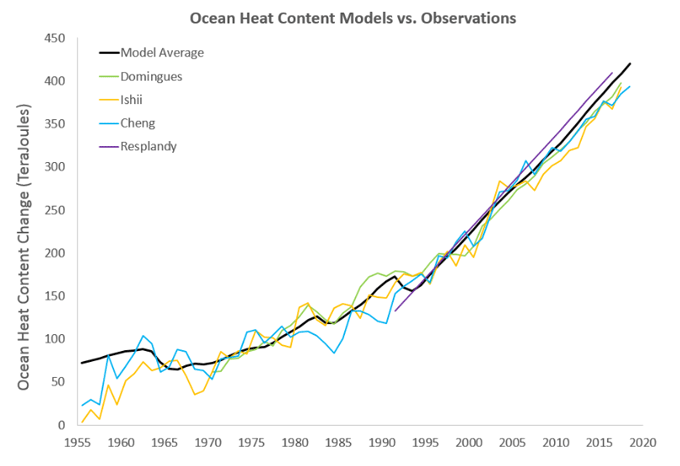
In the study’s key finding, the authors concluded that the latest ocean heat content estimates by their team and two others – using the latest corrections to XBT measurements, better statistical methods to fill in the gaps between XBT measurements, and up-to-date Argo data – now find that the rate of ocean heating is right in line with the average projections from climate models. The study authors also incorporated a clever recent study published in Nature, led by Laure Resplandy of Princeton University, that estimated ocean heat content changes based on the amount of oxygen and carbon dioxide being released by the oceans. That research yielded similar results
[NOTE: The Resplandy study has been retracted due to an underestimate of its uncertainties].
Ocean heat content best estimate data from Domingues et al. 2008 for 0–700 meters combined with Levitus et al. 2012 for 700–2000 meters (green); Ishii et al. 2017 (yellow); Cheng et al. 2019 (blue); Resplandy et al. 2018 (purple); and the Coupled Model Intercomparison Project Phase 5 (CMIP5) model average (black). Data provided by Lijing Cheng, chart created by Dana Nuccitelli.
There are a number of important points to take away from this research.
Posted by dana1981 on Monday, 4 February, 2019
 |
The Skeptical Science website by Skeptical Science is licensed under a Creative Commons Attribution 3.0 Unported License. |