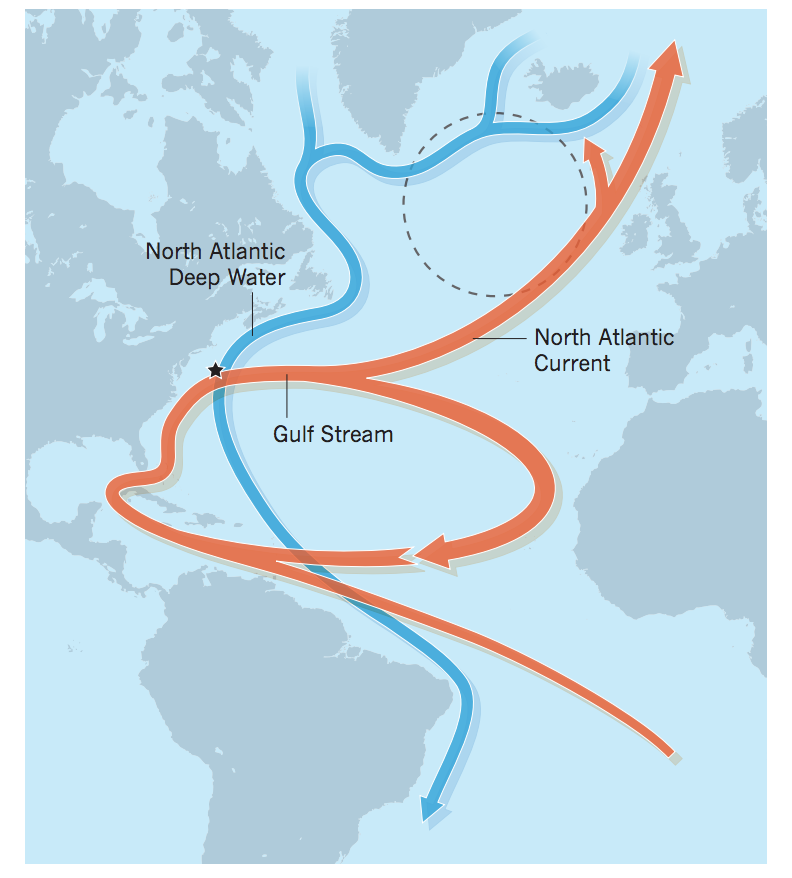
The Atlantic Meridional Overturning Circulation. Source: Praetorius (2018)
This is a re-post from Carbon Brief by Daisy Dunne
An international research programme has uncovered data that could transform scientists’ understanding of the Atlantic Ocean current – a circulation pattern that plays a central role in determining weather across the world.
The research, published in Science, challenges the long-held view that the strength of the “Atlantic Meridional Overturning Circulation” (AMOC) is primarily driven by processes in the Labrador Sea, which is in the north-west Atlantic.
Instead, the project finds that – over a 21-month period – the strength of the AMOC was most linked to processes in waters between Greenland and Scotland, more than 1,000 miles away in the north-east Atlantic.
The research is “very useful for our understanding of how climate change could affect the AMOC because it points us in the direction of which regions and processes might be particularly important for maintaining the overturning circulation”, a scientist tells Carbon Brief.
The AMOC – which is sometimes referred to as the “Atlantic conveyor belt” – is a large-scale ocean current that moves warm, salty water from the tropics to regions further north, such as western Europe.
The graphic below shows the two main parts of the AMOC. The first is the flow of warm, salty water in the upper layers of the ocean northwards from the Gulf of Mexico (red line). This is made up of the “Gulf Stream” to the south and the “North Atlantic current” further north.
The second is the cooling and freshening of water in the high latitudes of the Atlantic, which then sinks and returns southwards towards the equator at much deeper depths (blue line).
The Atlantic Meridional Overturning Circulation. Source: Praetorius (2018)
The warm water that the AMOC carries northwards releases heat into the atmosphere, which means it plays a crucial role in keeping western Europe warm. Without it, winters in the UK could be around 5C colder.
Scientists fear that climate change could be causing the AMOC to “slow down”. Last year, two studies published in Nature found that the AMOC had slowed by 15% since the mid-20th century. Further AMOC slowdown has been linked to an increased risk of intense storms in Europe and faster sea level rise in parts of the US, among other problems.
But to fully understand how climate change could affect the AMOC, scientists need to get a clearer picture of what drives the ocean current, says Dr Penny Holliday, a principal research scientist at the UK’s National Oceanography Centre and UK lead of the Overturning in the Subpolar North Atlantic Programme (OSNAP).
OSNAP, which was launched in 2014, involves more than 100 researchers from the UK, US, Canada, China, France, Germany and the Netherlands. It takes continuous measurements in the northern part of the AMOC – where warm water sinks and travels back towards the tropics – in order to get a better idea of what drives this “overturning”.
To do this, it has deployed two arms: “OSNAP East”, which extends from the Labrador Sea off the north-east coast of Canada to south-west Greenland, and “OSNAP West”, which reaches from south-east Greenland to the coast of Scotland. (The location of each arm is shown in red on the map below. The Labrador Sea is situated close to “AR7W”.)
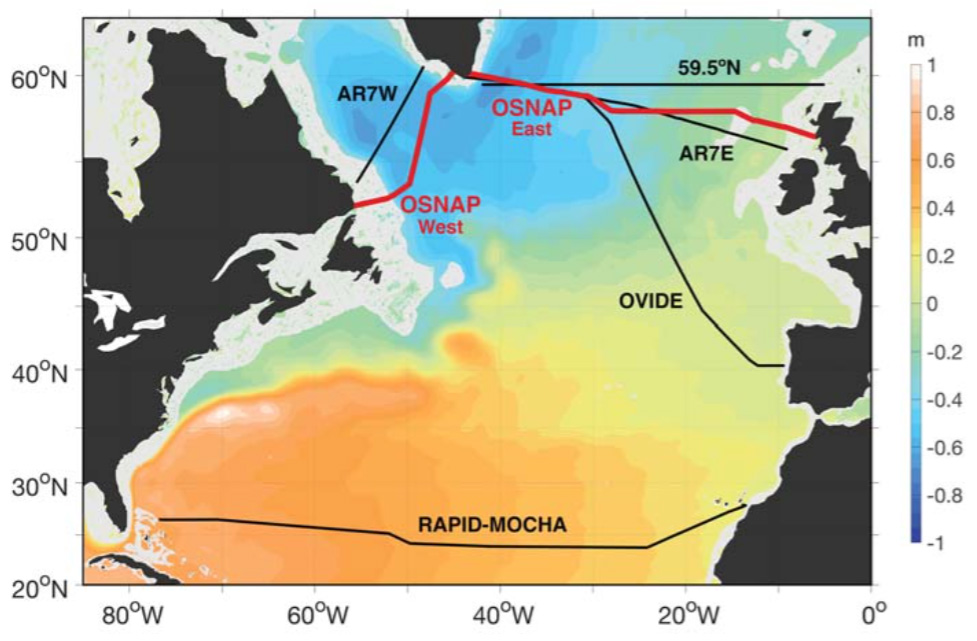
The Overturning in the Subpolar North Atlantic Programme (OSNAP) array (red). Also shown is the location of the RAPID array, the OVIDE array and a Canadian monitoring programme (“AR7W”). Colour represents ocean depth. Source: Lozier et al. (2019)
Each arm is made up of an array of measuring instruments – which enable the researchers to gather continuous measures of the strength of the ocean current, says Holliday:
“It consists of a whole load of moorings, which are ways in which we string instruments between the seafloor and the sea surface in the deep ocean. So there’s an anchor at the bottom and along that wire we string instruments that can measure various things like the speed of the water, the velocity of the water, temperature and the salinity.”
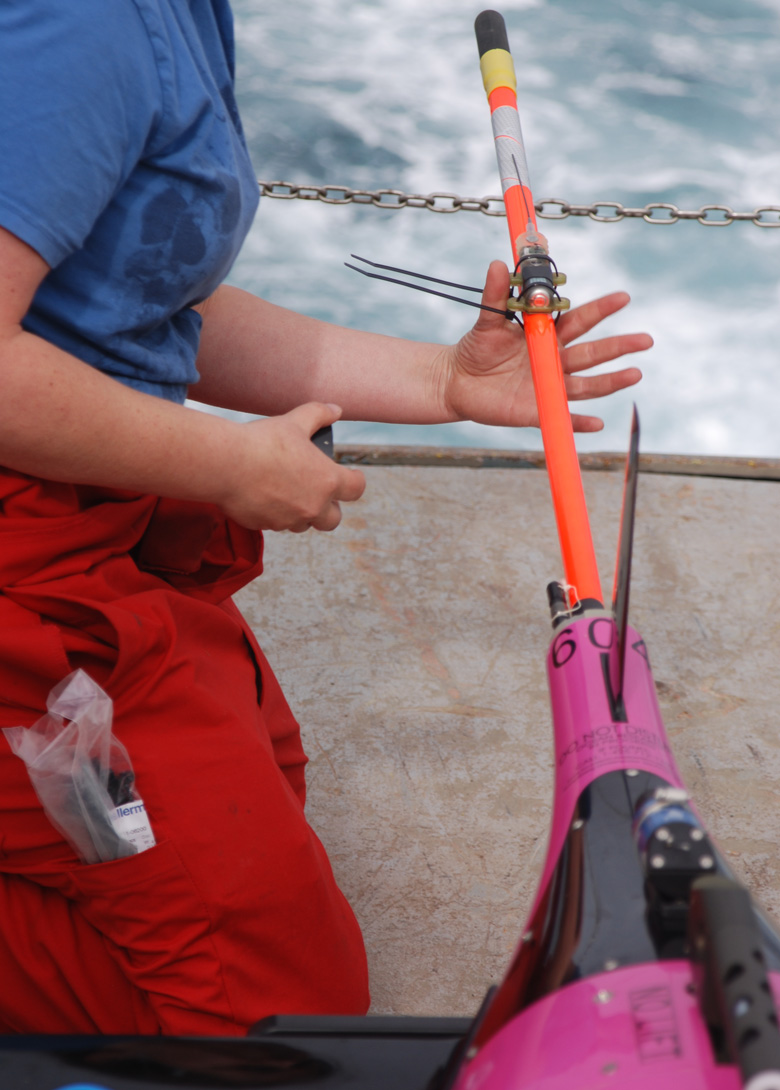
Scottish Association for Marine Science technician Karen Wilson performs final preparation of a Seaglider prior to deployment. Iceland Basin, July 2014. Source: Heather Furery, Woods Hole Oceanographic Institution
In the parts of the ocean that the moorings cannot reach, the researchers rely on Argo floats and gliders, she says:
“[Argo floats] drift around the ocean and, every 10 days, they surface and transmit their location and their data and then sink back to 2,000m. They give temperature and salinity data. The other part of the array are these things called “gliders” which are a bit like floats, but they have wings so that they can glide down to the deep ocean and glide back up again.”
A diagram of the layout of the measuring arrays deployed by the programme is shown below.
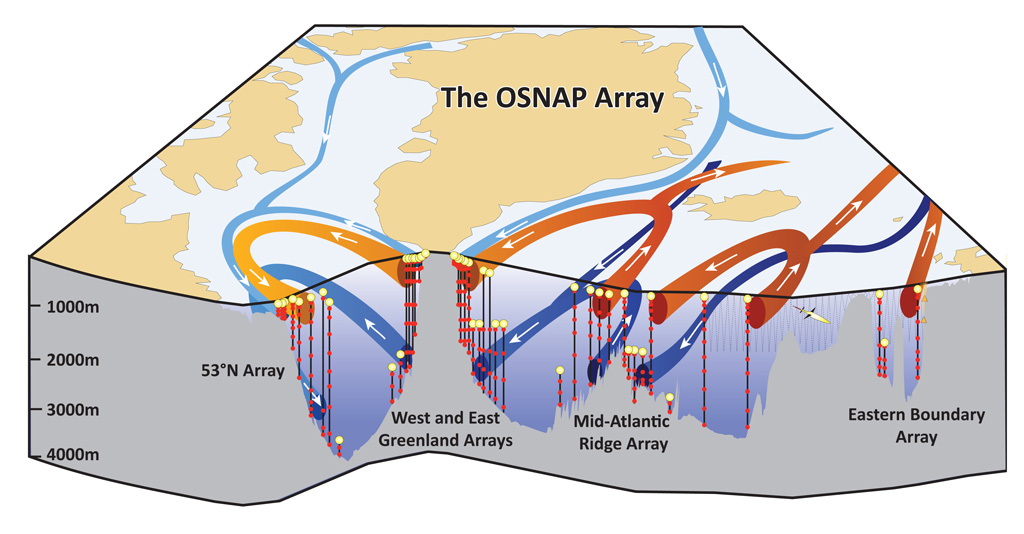
Schematic diagram of the Overturning in the Subpolar North Atlantic Programme (OSNAP) array. Central land mass is Greenland. Source: OSNAP
(There are several other long-term international projects monitoring different parts of the AMOC. These include the RAPID project, which has deployed an array of instruments reaching from Florida to Morocco (shown on the first map), and the National Ocean and Atmospheric Administration’s (NOAA) South AMOC monitoring programme, which reaches from South Africa to South America.)
The new study details the results of the first 21-month observing period of the OSNAP. One key finding is that the long-held view that the Labrador Sea was a key site in determining the strength of the AMOC could be incorrect, Holliday explains:
“We found that the mean and the variations in the strength of the overturning circulation is dominated by processes happening between Greenland and Scotland – we call it the ‘OSNAP east’ part. And, actually, the overturning that takes place in the Labrador Sea is rather small and doesn’t contribute to the month-to-month changes.”
This finding is shown on the graph below, where the black line represents the overturning circulation across the entire array, the blue line shows overturning in OSNAP east region and the yellow line shows overturning in the OSNAP west region (where the Labrador Sea is).
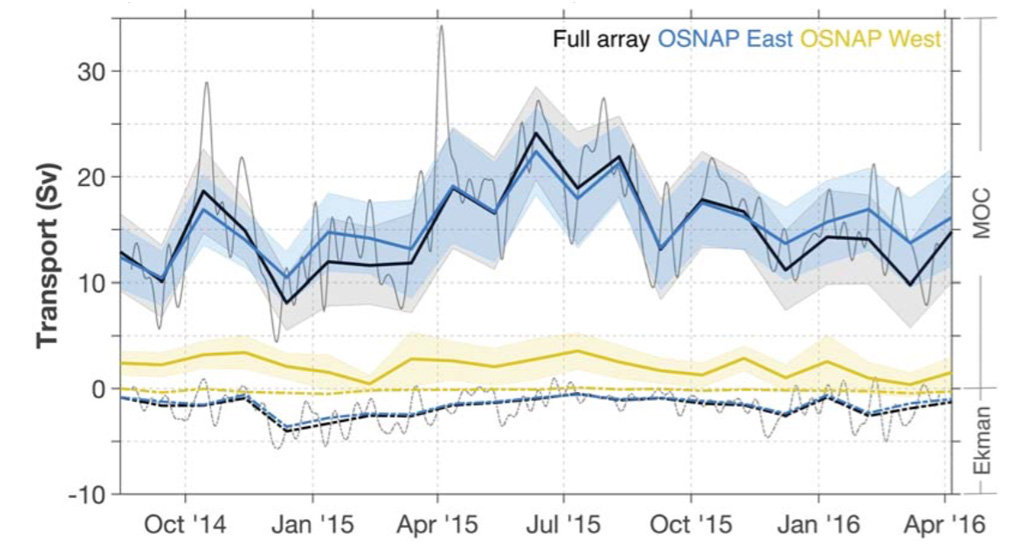
The meridional overturning circulation (MOC) across the entire array from October 2014 to April 2016 (black) is shown against the overturning circulation when split between OSNAP East (blue) and OSNAP west (yellow), measured in “Sverdrups” (Sv). Thin black line shows day-to-day changes in overturning. Grey shading represents uncertainty. “Ekman” shows the smaller influence of wind on heat transport. Source: Lozier et al. (2019)
The graph shows how waters around OSNAP east play a major role in determining the strength of the AMOC, Holliday says:
“The fact that the blue and the black line is really close together is saying that the OSNAP east region is dominating the [A]MOC and its variability.”
The findings represent an “exciting” step forward in scientists’ understanding of the AMOC, says Prof David Thornalley, a researcher of the AMOC from University College London, who is not involved in the OSNAP. He tells Carbon Brief:
“This finding is very useful for our understanding of how climate change could affect the AMOC because it points us in the direction of which regions and processes might be particularly important for maintaining the overturning circulation. We can then focus on examining how susceptible these regions and processes are to climate change.”
The findings suggest that changes to the Labrador Sea may have a played a smaller role in the AMOC slowdown observed over the past few decades than previously thought, says Prof Benoit Thibodeau, a researcher of the AMOC from the University of Hong Kong, who is also not involved in OSNAP. He tells Carbon Brief:
“This is not a total surprise as some studies already suggested that the linkage between convection in the Labrador Sea and the AMOC was weak. This…suggests that processes in the Labrador Sea do not seems to play an important role in the 20th century weakening of the AMOC and that we should pay more attention to the Irminger basin and the Nordic Seas when trying to apprehend potential consequences of climate change on the ocean circulation.”
Though the findings could cause scientists to refocus their studies, this does not mean that previous research projecting further weakening of the AMOC over the 21st century as a result of climate change is incorrect, Thornalley says:
“This paper is not really questioning the overall concept that warming and increased freshwater input at high latitudes is likely going to lead to a weaker AMOC. I think that is a pretty robust result most – pretty much all – scientists would agree with. However, this study does potentially alter our thoughts on exactly how it will weaken and what regions are the most critical.”
The findings are “very interesting” – but it could be too soon to draw conclusions, says Levke Caesar, a PhD student studying the AMOC from the Potsdam Institute for Climate Impact Research (PIK). She tells Carbon Brief:
“The time series is way too short to revise our understanding of the relative importance of the different convection sites. These first results rather stress the importance of continuing these measurements to connect the variability on such short time scales to that on the intra-annual to decadal scale.”
The results highlight how important long-term data collection is to fully understanding the impact of climate change on the AMOC, says Prof Monika Rhein, an oceanographer from the Institute for Environmental Physics at Bremen University, Germany, who is also not involved in OSNAP. In a Perspectives article accompanying the new research, she writes:
“Only long-term continuous time series can provide the much-needed benchmark to evaluate the climate model simulations. The promising results from the OSNAP array, its proximity to the Labrador Sea, and the questions raised about the processes causing AMOC variability provide excellent incentives to continue the OSNAP array for the next decades.”
Lozier, M. S. et al. (2019) A sea change in our view of overturning in the subpolar North Atlantic, Science, doi/10.1126/science.aaw3111
Posted by Guest Author on Tuesday, 26 March, 2019
 |
The Skeptical Science website by Skeptical Science is licensed under a Creative Commons Attribution 3.0 Unported License. |