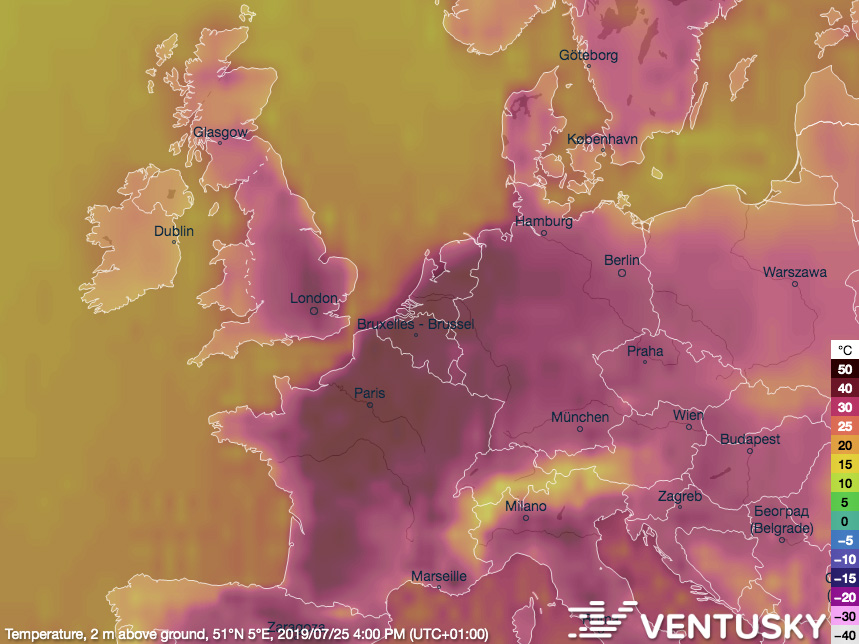
Data visualisation of air temperatures over Europe on Thursday, 25 July at 16:00 BST. Created with Ventusky.
This is a re-post from Carbon Brief by Daisy Dunne
The run of unprecedented temperatures in July – which sent records tumbling in the UK, the Netherlands, Belgium and Germany – would have been “extremely unlikely” without climate change, according to a new quick-fire analysis.
The hot weather seen in the Netherlands and France was made up to “100 times more likely” by climate change, the study finds.
And the heat in Cambridge in the UK – which saw a new country-wide record of 38.7C in July – was made around “20 times more likely” by human-caused warming.
The findings come from the latest analysis from the World Weather Attribution network. “Attribution” refers to a fast-growing field of science that aims to quantify the “fingerprint” of climate change on extreme-weather events.
Across Europe, the July heatwave was “much more extreme than any other heatwave we’ve looked at over the last few years”, a scientist from the network tells Carbon Brief.
Following a record-breaking early heatwave in June, Europe has now seen a second episode of unprecedented temperatures.
The extreme heat began across the continent on Sunday 21 July and reached its peak on Thursday 25 July – when the UK recorded its highest ever temperature of 38.7C at the Cambridge University Botanic Garden.
The hot weather caused days of travel chaos in the UK – as train engineers rushed to repair damaged rail lines and UK airports grappled with air traffic control issues.
Meanwhile, Belgium, Germany and the Netherlands also saw new temperature records, of 41.8C, 41.5C and 40.7C, respectively.
Paris also saw its hottest ever day on Thursday when temperatures reached 42.6C – hampering restoration work on Notre Dame Cathedral.
The map below shows the spread of temperatures across Europe as the heatwave reached its peak on Thursday, 25 July.

Data visualisation of air temperatures over Europe on Thursday, 25 July at 16:00 BST. Created with Ventusky.
The source of the unusual heat was North Africa, scientists say, drawn up to Europe because of high pressure to the east of the UK.
The new analysis explores how the likelihood of such an event could have been boosted by human-caused climate change.
To do this, the research team gathered temperature data taken from across 75 weather stations in France, Germany, the Netherlands and the UK, including in Oxford and Cambridge.
The findings show that the July heatwave was “unprecedented” in scale and intensity, says Dr Geert Jan van Oldenborgh, a member of the WWA network from the Royal Netherlands Meteorological Institute. He tells Carbon Brief:
“We find that it was much more extreme than any other heatwave we’ve looked at over the last few years. [It impacted] France, Luxembourg, Belgium, the Netherlands, western Germany, eastern England and also parts of Scandinavia – and at the moment it’s inducing a large melting event over Greenland.”
For the first part of their analysis, the researchers used long-term temperature data to work out how often a heatwave on the same scale as that seen in July is likely to occur in today’s climate.
They find that, in France and the Netherlands, the temperatures seen in the July heatwave had around a one-in-50 and one-in-150 chance of occurring, respectively. This means that the heat seen in France and the Netherlands was “rare”, the authors say.
The heat seen in the UK in July, however, was “less rare”, van Oldernborgh says:
“For Britain, it was not all that unusual. For Oxford, it was a one-in-10 year event. For Cambridge, it was a one-in-30 year event.”
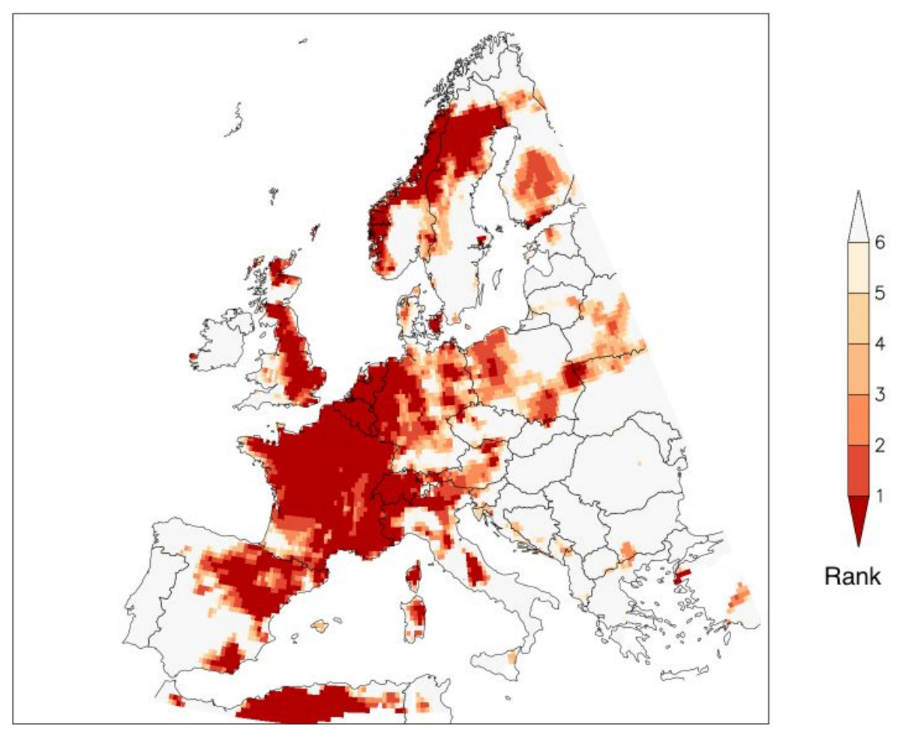
The chart below, taken from the analysis, shows the rank of annual maximum temperatures observed in Europe in 2019 when compared to 1950-2018. On the map, dark red indicates that the warmest annual temperature seen in 2019 is ranked first when compared to all the years between 1950 and 2018.

The rank of annual maximum temperatures observed in Europe in 2019 when compared to 1950-2018. On the map, dark red indicates that the warmest annual temperature seen in 2019 is ranked first when compared to 1950-2018. The authors say: “This figure is made with preliminary data and should be taken with caution as some measurements are not yet validated.” Source: World Weather Attribution
To explore the influence of climate change on France’s heatwave, the authors carried out an “attribution analysis” using a selection of climate models.
For each model, the authors produced two sets of simulations. These simulations compare the chances of a heatwave on the same scale as that seen in Europe in July occurring in today’s climate to the climate of 1900 – a time when the human impact on the climate was much less pronounced.
The simulations of today’s climate included many of the factors that can influence the climate, including human-driven greenhouse gases, volcanic eruptions and solar variability. The simulations from 1900 included all of these factors except for human-driven greenhouse gases.
The researchers then studied the simulations to see how often heatwaves on the same scale as that seen in July occur in both today’s climate and the climate of 1900.
The research finds that, in France and the Netherlands, “such temperatures would have had extremely little chance to occur without human influence on climate”. Climate change likely boosted the odds of the heat seen in these countries by up to 100 times, the authors say.
In comparison, climate change made the heat seen in the UK and Germany around “five to 10 times more likely”, the researchers say.
However, in Cambridge specifically – where the all-time UK temperature record was broken – the heat was made around 20 times more likely by climate change, according to the analysis.
As part of the analysis, the authors also looked at how extreme the temperatures seen during the July heatwave were in comparison to those seen in the past.
The authors find that the temperatures seen during this heatwave were around 3C higher than they would have been in 1900.
This is double the heatwave temperature increase expected by climate models – which are used to make projections about future climate change, van Oldernborgh says:
“The models only predict that heatwaves get warmer at about 1.5C per degree of global warming. So for every degree of global warming, they predict that heatwaves get 1.5C hotter – a little bit faster but not really exceptional.”
The world has seen around 1C of global warming so far – meaning that the models would expect heatwaves to be around 1.5C hotter today than in pre-industrial times. However, temperatures during this heatwave were actually around 3C warmer, he says:
“We really need to do a lot more serious research than we can do within one week to look at why there is such a big discrepancy between the observed trends and the modelled trends.
“But heatwaves are very special. A lot of things come together for a heatwave – heat from the Sahara, local heating due to sunshine, the reaction of vegetation due to very hot conditions – and all these things have to be modelled right. I’m just afraid that these models that have been designed to project the average climate correctly cannot handle these very extreme situations very well.”
The findings are yet to be published in a peer-reviewed journal. However, the methods used in the analysis have been published in previous attribution studies.
Posted by Guest Author on Monday, 5 August, 2019
 |
The Skeptical Science website by Skeptical Science is licensed under a Creative Commons Attribution 3.0 Unported License. |