This is a re-post from Carbon Brief by Daisy Dunne
Food production accounts for one-quarter of the world’s greenhouse gas emissions and takes up half of the planet’s habitable surface.
A taste for meat has had a particular impact on land. The mass of animals raised for slaughter on Earth now outweighs wildlife by a factor of 15-to-1. For example, for every person on the planet, there are approximately three chickens.
Meat and dairy specifically accounts for around 14.5% of global greenhouse gas emissions, according to the UN’s Food and Agricultural Organization (FAO).
If the world is to meet its target of limiting global warming to “well below” 2C, some degree of diet shift will be necessary, scientists say. If it is to strive for the most optimistic target of keeping warming to 1.5C, changes to diet may be even more crucial.
In this interactive Q&A, Carbon Brief explores how greenhouse gas emissions from meat, dairy and other diets compare, as well as whether changes to the production and transportation of meat could help to stem its climate impact.
This interactive Q&A is part of a week-long special series exploring how food is heating the planet.
In-depth Q&A: What does the global shift in diets mean for climate change?
Experts: How do diets need to change to meet climate targets?
Guest post: Coronavirus food waste comes with huge carbon footprint
Webinar: Do we need to stop eating meat and dairy to tackle climate change?
Guest post: Are low- and middle-income countries bound to eat more meat?
There are several ways to assess the relative climate impact of different food groups. The chart below compares the average greenhouse gas emissions produced per kilogram of different food products.
The analysis, which is based on a study published in Science in 2018, considers all the factors that go into producing food, including the land required for production, the farming process and the transportation and selling stages. (The emissions from each of these stages are discussed in more detail below.)
Greenhouse gas emissions per kilogram for different food groups. Adapted from Dr Hannah Ritchie/Our World in Data (2020) Data source: Poore & Nemecek (2018). Chart by Carbon Brief using Highcharts.The chart illustrates how the climate impact of beef and lamb dwarfs that of other foods. This is partly down to the biology of how these animals digest food, explains Prof Sir Charles Godfray, a population biologist and head of the Oxford Martin School at the University of Oxford. He tells Carbon Brief:
Cows and sheep are “ruminants” – meaning that their stomachs contain specialised bacteria capable of digesting tough and fibrous material, such as grass. The digestive process causes the animals to belch out methane, a greenhouse gas that is around 28-34 times (pdf) more powerful than CO2 over a 100-year period.
However, the chart illustrates that producing beef is more than twice as carbon intensive as producing lamb.
One reason for this is that cows take longer to grow and reproduce, meaning the production of beef requires much more feed and land than other types of meat.
The conversion of land for beef production and animal feed is a leading cause of deforestation in many tropical regions, including in the Amazon, where a recent spike in forest fires and clearing has been linked to cattle ranching. Prof Walter Willett, a leading nutritionist at the public health school of Harvard University, tells Carbon Brief:
Grazing cattle need plentiful supplies of grass – meaning farmers often use nitrogen fertiliser on their fields to stimulate plant growth. The production of nitrogen fertiliser causes the release of CO2 and the potent greenhouse gas nitrous oxide (N2O).
(It is worth noting that emissions from beef can vary greatly. See: Do farming and production conditions affect meat and dairy emissions?)
The resource-intensive nature of cattle rearing also explains why, on average, cheese and other dairy products have a higher climate cost than pork and poultry. Also, chickens and pigs are not ruminants and so do not produce as much methane.
The chart also shows that, on average, farmed prawns have a larger climate impact than other types of seafood.
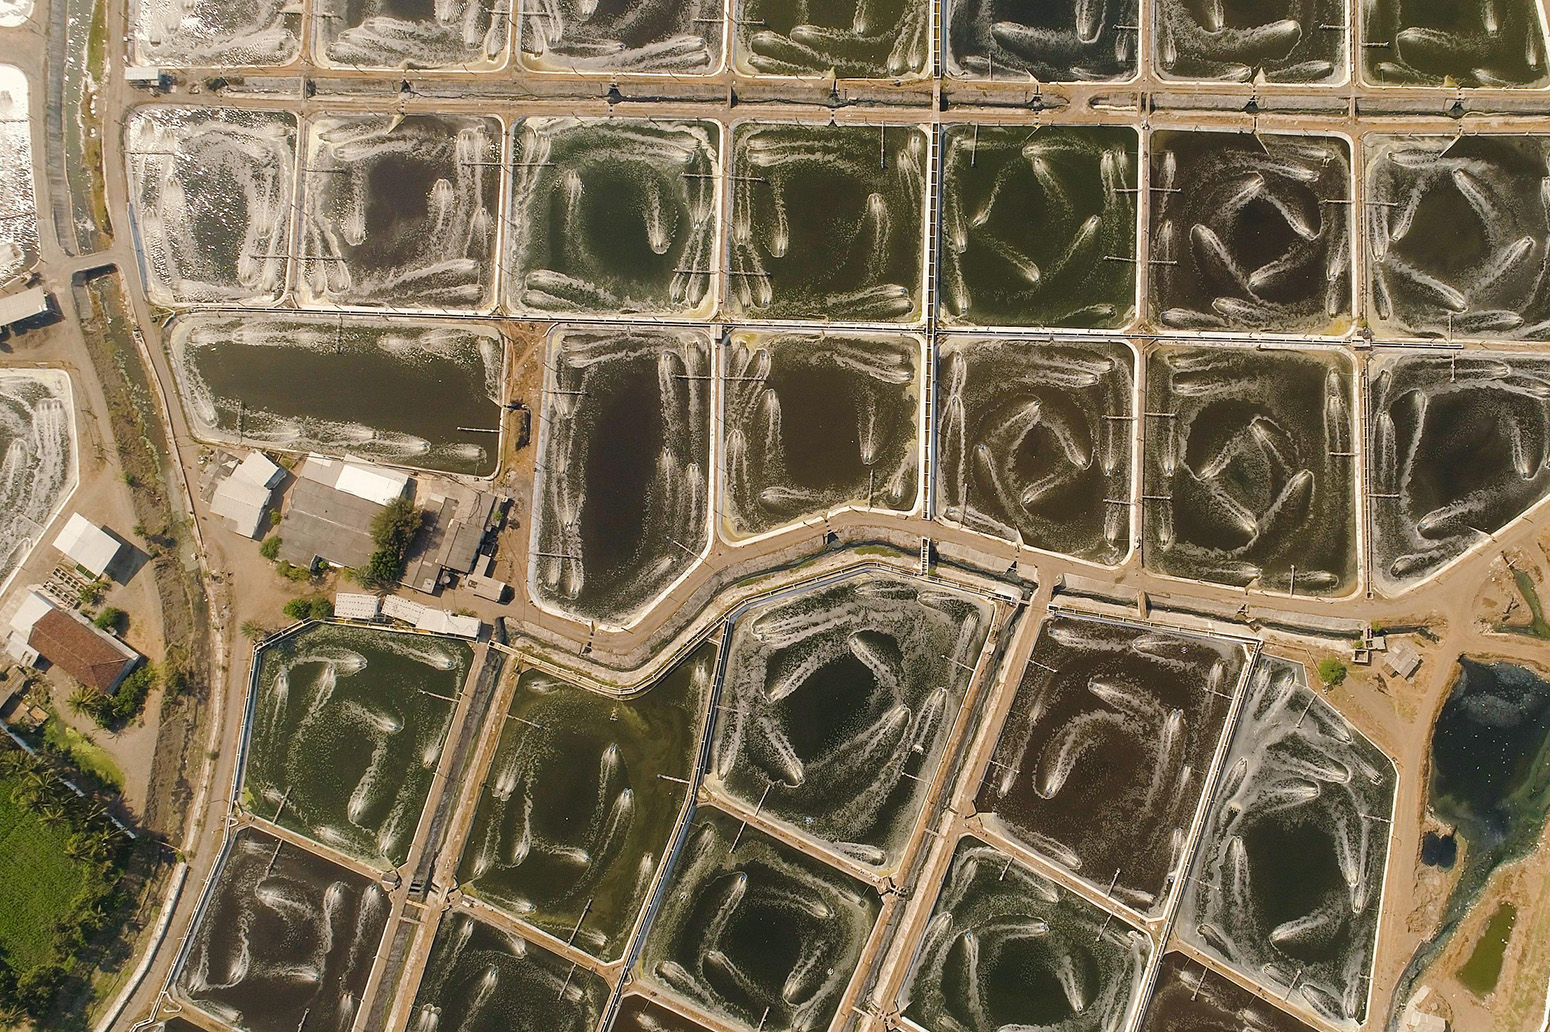
This is partly due to the fact that some parts of southeast Asia have seen a boom in “industrial-scale” aquaculture.
In these systems, prawns are fed with high amounts of fish feed, much of which is wasted and taken up by other marine microorganisms which then release methane into the atmosphere. Aquaculture also often requires carbon-rich mangroves to be cut down, which causes large amounts of CO2 to be released.
Aerial view fish farm in Java, Indonesia, with ponds growing fish and shrimp and other seafood. Credit: Alexey Kornylyev / Alamy Stock Photo.
In comparison to meat and dairy, plant-based foods have much smaller carbon footprints. On average, emissions from plant-based foods are 10 to 50 times smaller than those from animal products, according to the Science study.
Notable exceptions on the chart above include coffee and chocolate. Coffee is mostly grown in tropical regions and its production often involves using high amounts of nitrogen fertilisers, which mostly explains why it has a larger climate impact by kilogram than other plant-based foods. Chocolate’s climate impact is mostly caused by the land-use change required to produce cocoa.
However, it is worth noting that both coffee and chocolate do not contribute much to nutrition, says Dr Hannah Ritchie, a senior researcher at the Oxford Martin School and head of research at Our World in Data. Ritchie, who conducted the analysis behind the chart above, tells Carbon Brief:
The chart below shows the average greenhouse gas emissions for different food products per 100g of protein, rather than for weight alone.
This chart shows that, when protein is considered rather than mass, dark chocolate has the highest footprint. (However, it is worth noting that chocolate typically contains a very small amount of protein in comparison to animal products such as beef and lamb – and therefore a consumer would need to eat much more of it to derive the same amount.)
Greenhouse gas emissions per 100g of protein for different food groups. Adapted from Dr Hannah Ritchie/Our World in Data (2020) Data source: Poore & Nemecek (2018). Chart by Carbon Brief using Highcharts.
Given that the climate impact of plant-based foods is typically 10 to 50 times smaller than that of animal products, it follows that switching from a largely meat-based diet to a vegetarian or vegan diet could help to reduce emissions.
The chart below shows how much greenhouse gases could be stemmed if the world were to adopt various different diets.
Greenhouse gas savings potential from the global adoption of various diets. Error bars show the spread of results from different studies. Data without error bars are from one study only. Adapted from IPCC (2018). Chart by Carbon Brief using Highcharts.The analysis comes from a report by the Intergovernmental Panel on Climate Change (IPCC), an independent research group made up of the world’s leading climate scientists. The report defines the different diets referenced in the chart above as follows:
In the IPCC’s special report on climate change and land, the team of scientists analysed recently published scientific papers that look into how these different diets could help to stem greenhouse emissions.
The chart above displays the total amount of greenhouse gases that could be saved each year by 2050 if the world were to adopt each of these diets, when compared to a “business-as-usual” scenario for 2050. (The “business-as-usual” scenario is based on projections of continued population growth and rising meat intake from the FAO.)
(The chart shows the savings in terms of millions of tonnes of CO2 equivalent [CO2e] – a measure used to compare the emissions from various greenhouse gases.)
Savings come both from ridding the world of the greenhouse emissions associated with livestock production (see: How do emissions from meat, dairy and other foods compare?) and also from sparing land that would otherwise be needed for livestock rearing.
The analysis shows that a global switch to veganism would deliver the largest emissions savings out of any dietary shift.
According to the analysis, a switch to veganism could save almost 8bn tonnes of CO2e a year by 2050, when compared to a “business-as-usual” scenario. (By comparison, all food production currently causes around 13.7bn tonnes of CO2e a year.)
The steep reduction in emissions would partially stem from the freeing up of large amounts of land, which could be used to plant forests capable of removing CO2 from the atmosphere, the IPCC authors say:
(Separate research finds that the emissions savings from a global switch to veganism could actually be as high as 14.7bn tonnes of CO2e a year.)
The second highest emissions savings would be delivered by a global shift to vegetarianism which, in the analysis, still includes around one serving of meat or fish a month. An adoption of this diet could save 6bn tonnes of CO2e a year by 2050, according to the analysis.
Following this is a shift to “flexitarianism” – a diet where three-quarters of meat and dairy is replaced by plant-based alternatives. A global shift to this diet could save just over 5bn tonnes of CO2e a year by 2050, the analysis says.
It is worth noting that, while veganism offers large emissions savings when compared to a “business-as-usual” scenario, the additional benefits become smaller when compared to vegetarianism and flexitarianism, says Willett:
The analysis also shows that a global shift to “healthy” eating could offset around 4.5bn tonnes of CO2e a year by 2050.
In addition, the majority of national healthy eating guidelines recommend that their citizens eat less meat and more fruits and vegetables. (For example, Public Health England’s Eatwell Guide suggests the average Briton should eat less red and processed meat and consider choosing low-fat alternatives to dairy.)
A study published in 2016 found a global shift towards more plant-based diets that are in line with standard dietary guidelines could reduce global mortality by 6-10% by 2050 in addition to reducing emissions by 29-70%, when compared to a business-as-usual scenario.
A global shift towards a more plant-based diet would help to reduce emissions, but it is worth bearing in mind that every country in the world eats differently.
A country’s diet – and its resulting food emissions – can be based on many factors, including its cultural and religious beliefs, geography and economic status.
In 2019, a group of leading food and climate scientists came together to analyse how different countries around the world eat – and how this might need to change if the world is to reduce the climate impact of food. Willett, who led the project, which is known as the EAT-Lancet Commission, tells Carbon Brief:
For the first part of their analysis, the commission analysed the scientific literature in order to come up with a universal diet that would be healthy and sustainable for all.
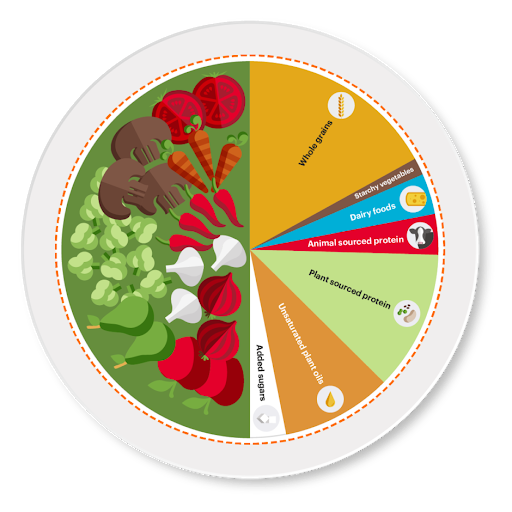
The “planetary health diet”. Credit: The EAT-Lancet Commission (2019).
The “planetary health diet” – illustrated above – is around half fruit and vegetables, with whole grains, unsaturated plant oils and plant-sourced proteins also playing a large role.
The diet allows for around one portion of dairy a day and around one serving of meat a week, says Willett:
For the second part of their analysis, they assessed how the dietary habits of different parts of the world would need to change to fit with their proposed planetary diet.
Posted by Guest Author on Friday, 25 September, 2020
 |
The Skeptical Science website by Skeptical Science is licensed under a Creative Commons Attribution 3.0 Unported License. |