This short blog post and the linked PDF document is the result of a collaborative effort by Anne-Marie Blackburn, Dana Nuccitelli, Bärbel Winkler, Ken Rice and John Cook.
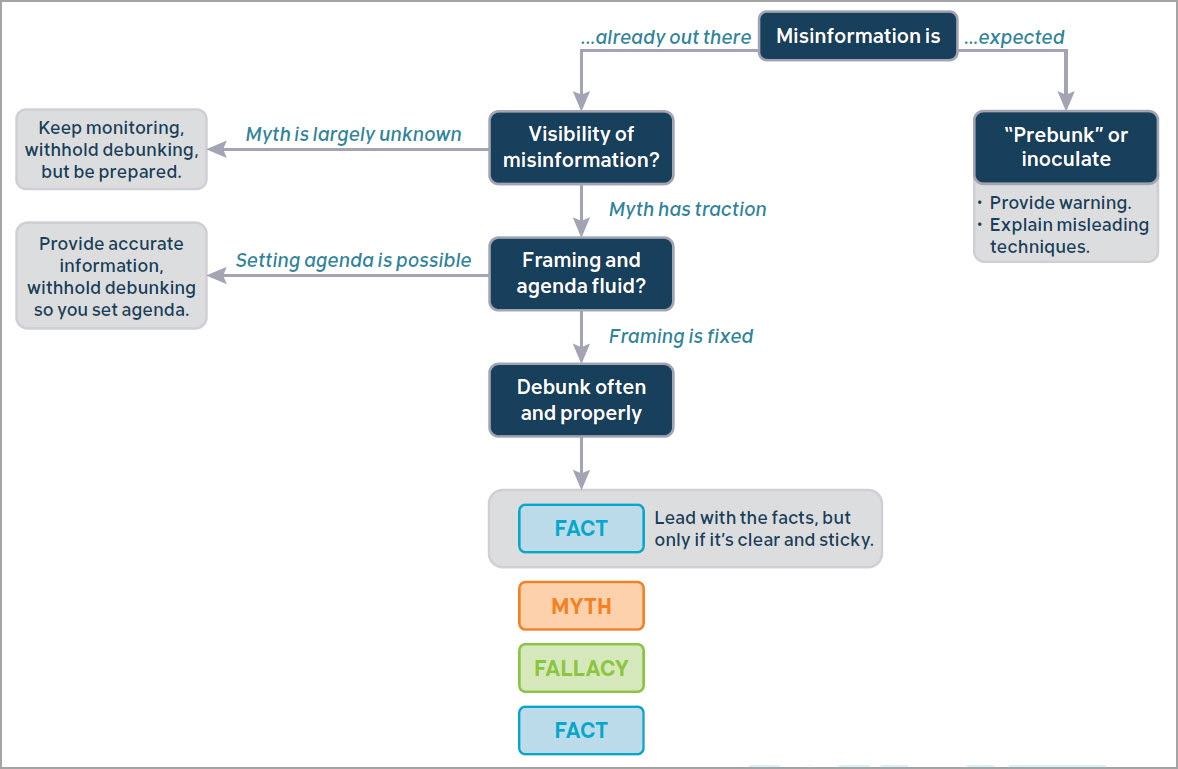
When the climate change (mis)information briefs pushed by David Legates and others started to make the rounds in January 2021 we wondered whether or not they would be worth spending any time to debunk. This is sometimes a bit of a toss-up as, on the one hand, you have to debunk misinformation often and properly, while on the other you don’t want to give it undue publicity while doing so. This is illustrated by this chart from the recently published Debunking Handbook 2020 outlining the strategic landscape for debunking:
Figure 1: The strategic landscape of debunking (The Debunking Handbook 2020)
Eventually the urge of some of our team members to debunk these briefs won out and Anne-Marie Blackburn, Dana Nuccitelli, Bärbel Winkler, Ken Rice, and John Cook collaborated to put together a document for easy reference to point people to as and when needed. Instead of providing detailed explanations of all that is wrong in the flyers, we decided to quickly identify the most obvious examples of long-debunked myths. These are shown in the document as screenshots (Figure 2) from the flyers followed by a link to the relevant rebuttal and a short explanation of why the assertion is wrong:
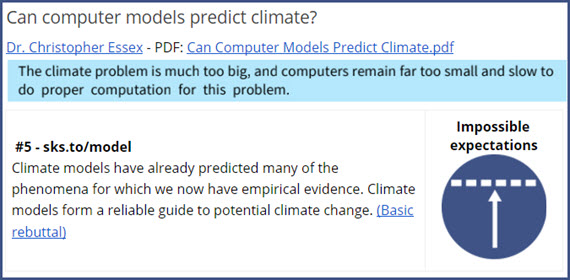
Figure 2: Example debunking showing a screenshot from the climate briefs
In addition to simply mentioning the myth, we also identified the logical fallacies underpinning these errors as a way of illustrating the recurring flaws in arguments that claim to discredit the science of climate change. You can read the complete document here.
Once we were done with this exercise we had identified at least 13 long-debunked myths in the flyers, some of which made an appearance more than once. As a picture says more than a thousand words, here is the myth rebuttal chart with the most obvious myths checked (Figure 3):
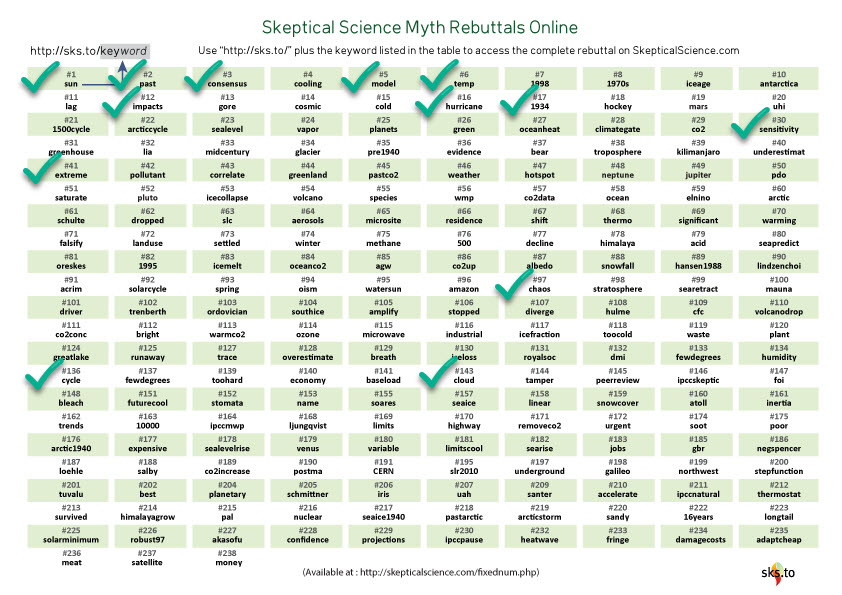
Figure 3: Myth Rebuttal Chart (click for larger version)
As mentioned above, we also applied FLICC to the arguments made and identified several of the typical characteristics of science denial. Not too surprisingly, cherry picking was most often used (5 times) followed closely by impossible expectations (4 times) and oversimplification (3 times). Here is the corresponding graphic (Figure 4):
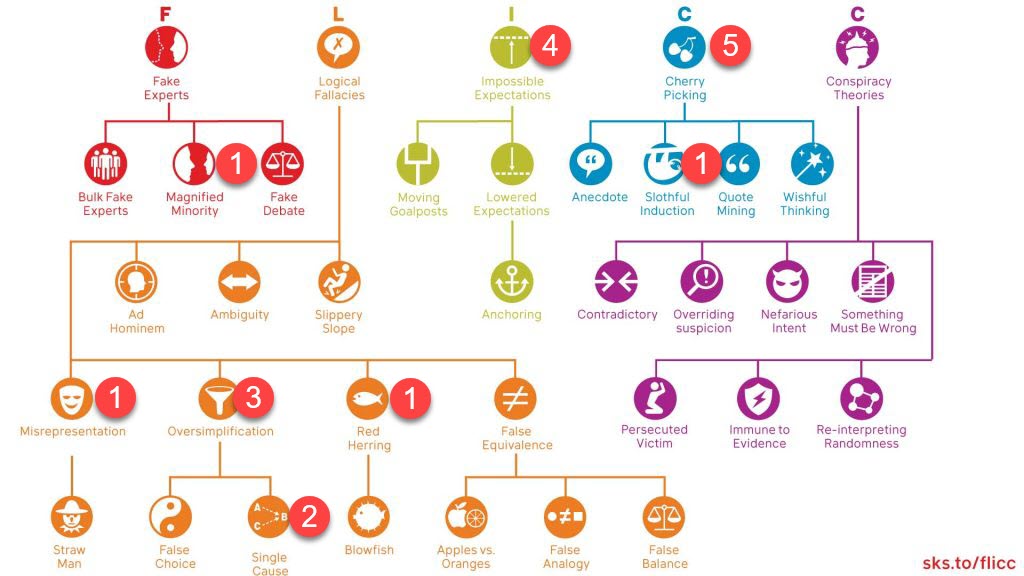
Figure 4: FLICC Chart (click for larger version)
To learn more about the overall taxonomy check out A history of FLICC: the 5 techniques of science denial.
Bottom line: this task required more time and effort than the flyers deserve, but on the other hand, the way we did it may serve as a recipe to go about future such activities, which we all wish wouldn’t occur but also know will happen again sooner rather than later.
Posted by BaerbelW on Thursday, 28 January, 2021
 |
The Skeptical Science website by Skeptical Science is licensed under a Creative Commons Attribution 3.0 Unported License. |