Illustrating what causes complex temperature patterns.
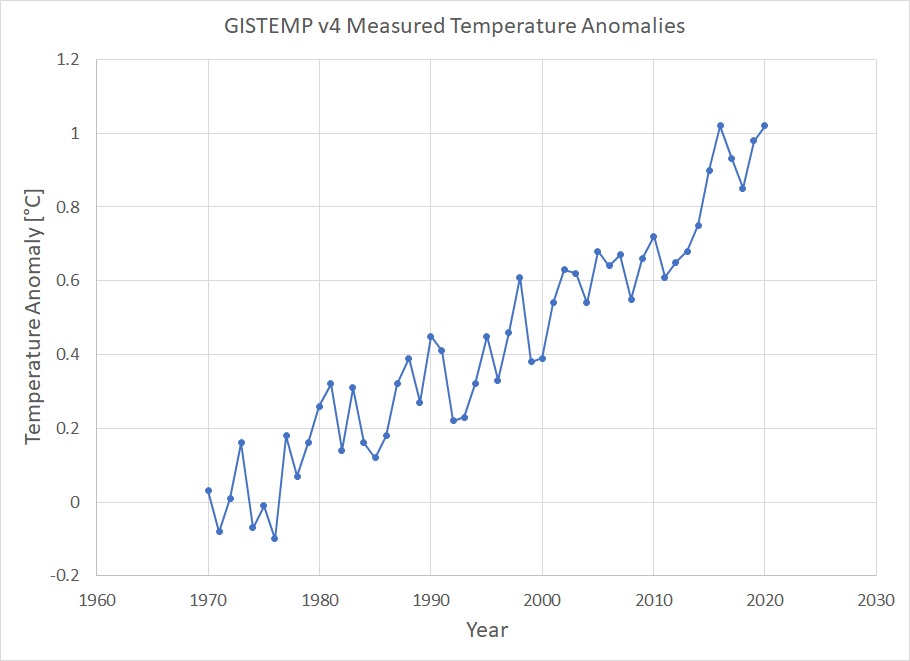
What causes the complicated patterns in measured temperature anomalies from year to year? Why is there so much variation, and do you need a Ph.D. in climate science to understand what creates such erratic patterns in measured temperature anomalies, such as those shown in Fig. 1? Although the plot of temperature anomaly vs. year might appear random, there are many known processes that create the detailed, complicated structure, such as energy exchange between the oceans and the atmosphere described in Energy SeaSaw Part I.
Figure 1. Temperature anomalies from 1970 to 2020 from the NASA GISTEMP v4 data set.
It is clear from Fig. 1 that temperature anomalies are increasing, but from year to year there are significant ups and downs. Another way to get a feel for how regular processes create what appears to be random variations on an otherwise increasing trend, consider the evolution of the financial assets of a typical family over a single year. Figure 2 shows the hypothetical ups and downs superimposed on top of steadily increasing assets.
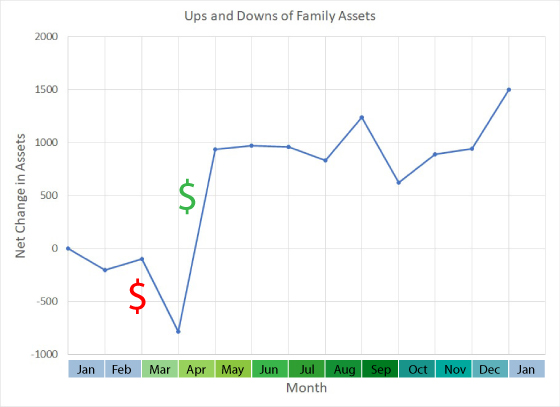
Figure 2. Net change in assets over a single year for a typical modern family.
Figure 2 indicates that over a single year the net assets increase by 1500, but with substantial month-to-month variability. Although this is a complicated monthly change in assets, it stems from expenses that are familiar to most people and include the following.
Although typical families have regular income and expenses, the month-to-month timing is variable. Although income is relatively consistent and uniform (such as energy received from the sun), expenses are, by nature, variable. When we pay taxes to the government, many people pay estimated taxes during the year that exceed the amount they owe, and then receive a single, lump-sum payment in the form of a tax return. This is similar to the rapid warming that may occur during an El-Nino year, when excess, stored energy in the oceans is released to the atmosphere as a relatively rapid burst. Understanding the underlying physics that create the seemingly complicated, measured temperature anomalies is not much different than understanding the income and expenses that create the pattern of how the assets of a typical family change over the course of a year.
For a description of the effects of El-Nino/La-Nina, volcanoes, and solar insolation on observed temperature anomalies, such as those shown in Fig. 1, see Foster and Rahmstorf (2011). They demonstrate how the effects of El-Nino/La-Nina, volcanoes, and solar insolation can be removed from measured temperature data sets to reveal more clearly the underlying, consistent warming signal.
Also check out this very informative illustration by Bloomberg Businessweek. They present the individual effects of many different natural and human-induced factors, and show how together all of these natural and human-induced factors add up to give us the observed temperature history.
Grant Foster and Stefan Rahmstorf 2011 Environ. Res. Lett. 6 044022.
Posted by Evan on Monday, 28 June, 2021
 |
The Skeptical Science website by Skeptical Science is licensed under a Creative Commons Attribution 3.0 Unported License. |