In the context of IPCC goals and company initiatives, “Net-Zero” means achieving the point where an entity emits no net GHGs. That entity could be a single company,1 an entire country, or the entire Earth; the ultimate goal of the Paris Accord. Two related questions are
Deceptively simple questions with not quite so simple answers.
Humans must remove from the atmosphere the same amount of CO2 that we emit. That is the meaning of Net-Zero. If we do this, the environment has a carbon-removal matching plan such that it will remove additional CO2 on our behalf, for free, so that if/when we reach Net-Zero Emissions, atmospheric CO2 concentrations will actually start to decrease!
How cool is that. The atmosphere is ready to help out with a carbon-removal matching plan, as long as we do our part. Although no countries have yet achieved Net-Zero Emissions, some companies, such as Google, claim to have already become carbon neutral, which means essentially the same thing as achieving Net-Zero Emissions. But here is an important distinction.
Carbon free is what we would like, but because running completely carbon free is probably not possible, carbon neutral is needed to reach Net-Zero Emissions.
A problem using trees to offset carbon emitted today is that it represents a promise to remove tomorrow what we emit today. That is, once the carbon is emitted, a significant portion will remain in the atmosphere for 1000’s of years, or until we physically remove it. That’s what trees and other carbon-removal technologies are supposed to do at some future date. However, even though we plant trees, we cannot guarantee their long-term survival nor that they will survive land-use policy changes by future administrations.
We can praise companies that make the effort to become Net-Zero, but even if well-intentioned marketing divisions of large corporations convince their users and shareholders that they are now a green, environmentally-responsible company, nature is not so easily convinced. And nature is the only judge of our efforts that matters. How can we monitor what nature is seeing as the sum total of our efforts to reach Net-Zero status?
Although we can imagine how to assess the approach of a single company to Net-Zero status, how do we assess if an entire country has reached this goal? And then, the entire world?
When the IPCC and climate scientists refer to “Net-Zero”, they are implicitly referring to entities achieving Net-Zero Emissions, meaning that we remove from the atmosphere as many GHGs as we emit. Along the road to this ultimate goal, Net-Zero Accumulation represents a more readily verifiable way-point than Net-Zero Emissions. Net-Zero Accumulation simply means that the long-term trend of the Keeling Curve stabilizes at some concentration. Any concentration. Although our ultimate objective should be Net-Zero Emissions, considering that in 2021 the long-term trend of the Keeling Curve is accelerating upwards, achieving Net-Zero Accumulation would be a monumental milestone, on its own, on the road to Net-Zero Emissions.
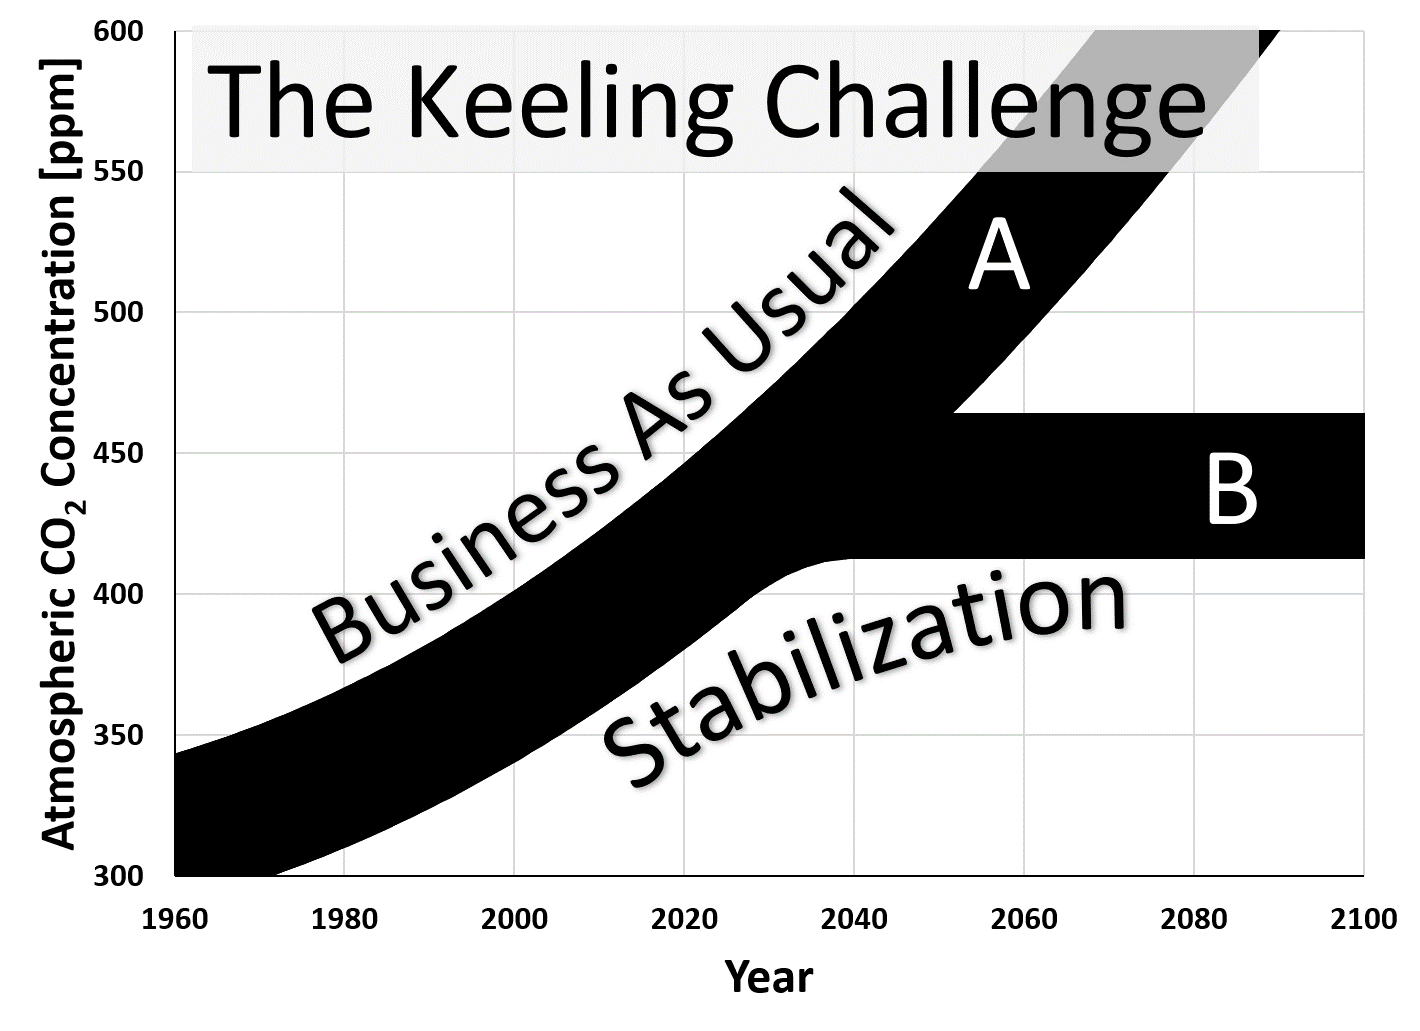
Figure 1 represents the Keeling Curve as polynomial fits projected into the future along a Business-As-Usual (BAU) trajectory (Fig. 1A) and along a trajectory leading to Net-Zero Accumulation by 2040 (Fig. 1B). 2040 is chosen arbitrarily as a check on our progress towards the ultimate goal of achieving Net-Zero Emissions by 2050. That is, if we don’t achieve Net-Zero Accumulation by 2040, then we must increase our decarbonization efforts such that we reach the ultimate goal of Net-Zero Emissions by 2050: by definition, we will achieve Net-Zero Accumulation before achieving Net-Zero Emissions.
The trend lines in Fig. 1 are shown as thick lines, to emphasize the difficulty in bending these curves. Fossil fuels are engrained in every aspect of our lives, and removing our dependence on them will not be easy. That is the reason for showing the trend lines in a manner that illustrates resistance.
Figure 1. A) Business-As-Usual (BAU) projection of CO2 and B) required adjustment to BAU trajectory to achieve Net-Zero Accumulation by 2040. The fat curves emphasize the difficulty of counteracting the BAU trend.
Here’s an exercise you can do to visualize the task we’re up against. Find a large tree branch that is bent upwards, in the shape of the Keeling Curve. One end of the branch represents 1958, the start of the Keeling Curve, and somewhere in the middle represents today. The branch should match the shape of the curve between those two years and continue bending upwards, similar to the shape in Fig. 1A.
When selecting your branch, remember that we are a planet of 8 billion people whose lives must be realigned to this Net-Zero challenge. Think of each person representing a single strand in the curved branch you select. The more people, the thicker the branch. Do not pick a wimpy branch.2
Now bend the branch so that it is level with the ground, similar to the shape of Fig. 1B. This represents Net-Zero Accumulation, because it corresponds to a stabilization of the Keeling Curve. Continue bending the branch until it is curved downwards. That is something like our approach to Net-Zero Emissions. Did you get the branch to start bending down by 2050?
And by the way, breaking the branch is not allowed, because that would represent massive disruption. Achieving Net-Zero, whether Net-Zero Emissions or Net-Zero Accumulation must be done in a non-destructive manner.
Get the picture?
What if we “only” achieve Net-Zero Accumulation by 2050? This would not be as good as achieving Net-Zero Emissions, but would be way better than the BAU trend we are currently riding. If we were able to achieve Net-Accumulation by 2040 or 2050, there is a good chance that CO2 concentration would allow us to stay close to the 2°C warming. Getting to Net-Zero Accumulation by 2050 would, in itself, be an enormous and significant achievement, the accomplishment of which we can readily verify.
In any case, charting our progress towards Net-Zero Emissions is a task for international agencies that monitor the emissions of every country. However, anybody with Internet access can monitor our approach to a Net-Zero Accumulation way-point: you only need to track the progression of the Keeling Curve.
Or is it that easy?
We fit trend lines to data and make nice, smooth projections into the future. But atmospheric CO2 concentration data is not this well behaved. Year-to-year variability means that trend lines must be fit to multiple years of data to tease out the statistically-significant data trends. How does this affect our ability to assess our approach to Net-Zero Accumulation?
Although a rigorous treatment of this subject is well beyond the scope of this paper, we can get a good idea of how natural variability affects our view of the data as follows. Using the trend lines shown in Fig. 1, I added artificial, natural variability to the future projections, by using the data variability from the data from 2000 to 2020, shown as circles in Fig. 2. I applied this natural variability to the future projections shown in Fig. 2 (represented by the squares and diamonds). Note how this causes the square and diamond “data points” in Fig. 2 to vary up and down about the trend line in a similar manner that the real data from 2000 to 2020 varies up and down about the trend line. This exercise teaches us two things.
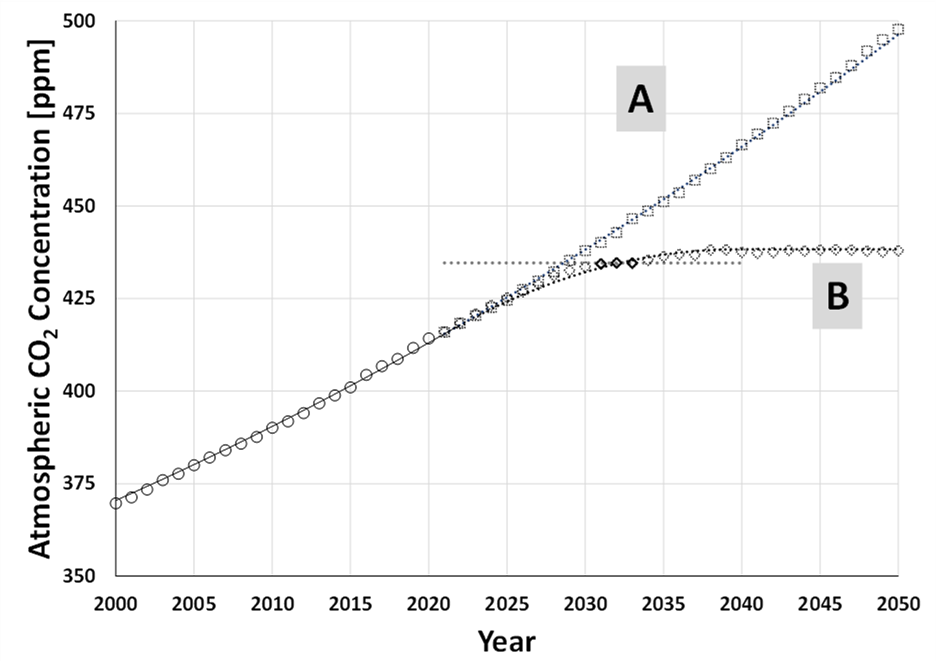
Figure 2. A) Future projections along a BAU trajectory and B) assuming that CO2 concentrations stabilize by 2040.
Figure 2 shows that even when comparing the worst-case scenario, BAU, against the best-case scenario (stabilization of CO2 by 2040), and assuming we begin aggressive CO2 stabilization in 2021, because of annual variability in measured CO2 , it is not possible to distinguish a difference in these two very extreme cases until about 2030. At least not for casual observers. It may be that statisticians can tease out a difference before 2030, but the point is that it takes time to definitively see the effect of carbon-reduction efforts on the Keeling Curve.
The second feature to note is that natural variability can make it appear that CO2 stabilizes by 2031, a full 10 years before the stabilization date used to create the lower trend line. This is illustrated by the three solid diamond “data points” in the lower curve, with a horizontal trend line drawn through them.
Whereas monitoring our approach to Net-Zero Accumulation is a useful check on our progress towards the bigger goal of Net-Zero Emissions, trends over at least 5 years are needed to verify stabilization of atmospheric CO2 concentrations.
Although we ultimately rely on professional Climate Scientists and the IPCC to inform us of how well we’re doing and to recommend needed course corrections along the way, as an independent observer you can monitor our progress by following the progression of the Keeling Curve as we navigate our way into the future.
1. Some companies have already declared they are Net-Zero, and some are even declaring that they will compensate for all legacy carbon emissions.
2. We realize that the carbon footprint varies greatly from country to country, and therefore the contribution to the thickness of the branch depends on the carbon intensity of each individual’s lifestyle, but in some simplistic sense, if the world was populated by 1/10th the people spread across similar income divides, the problem of bending the Keeling Curve would presumably be that much easier.
Zeke Hausfather, Will global warming stop as soon as Net-Zero Emissions are reached?
Posted by Evan on Friday, 5 November, 2021
 |
The Skeptical Science website by Skeptical Science is licensed under a Creative Commons Attribution 3.0 Unported License. |