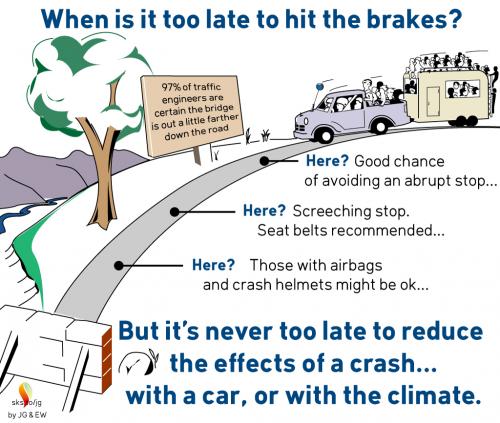
How fast is too fast?
While driving down a road you get distracted and look down. When you look up, you see a brick wall directly in front of you blocking the road, because the bridge ahead is out. No matter what you do, you will hit the wall. What can you do to minimize the damage to your car and to its occupants?
Increasing atmospheric CO2 concentrations drive global warming. Global warming drives climate change. The rate of increase of CO2 is important because it determines the rate of global warming, and therefore the rate at which natural systems must adapt to a changing climate. Figure 1 shows CO2 concentrations from the end of the recent ice age to the present. Think of Fig. 1 as the Keeling Curve with historical context, illustrating how rapidly CO2 is rising relative to the most recent deglaciation rate. If we limit the rate of increase of CO2 to that experienced during a deglaciation cycle, we expect nature will adapt; the further away we move from this base rate the more difficult it is for nature to adapt, because rapid rises of temperature are often associated with extinction events.
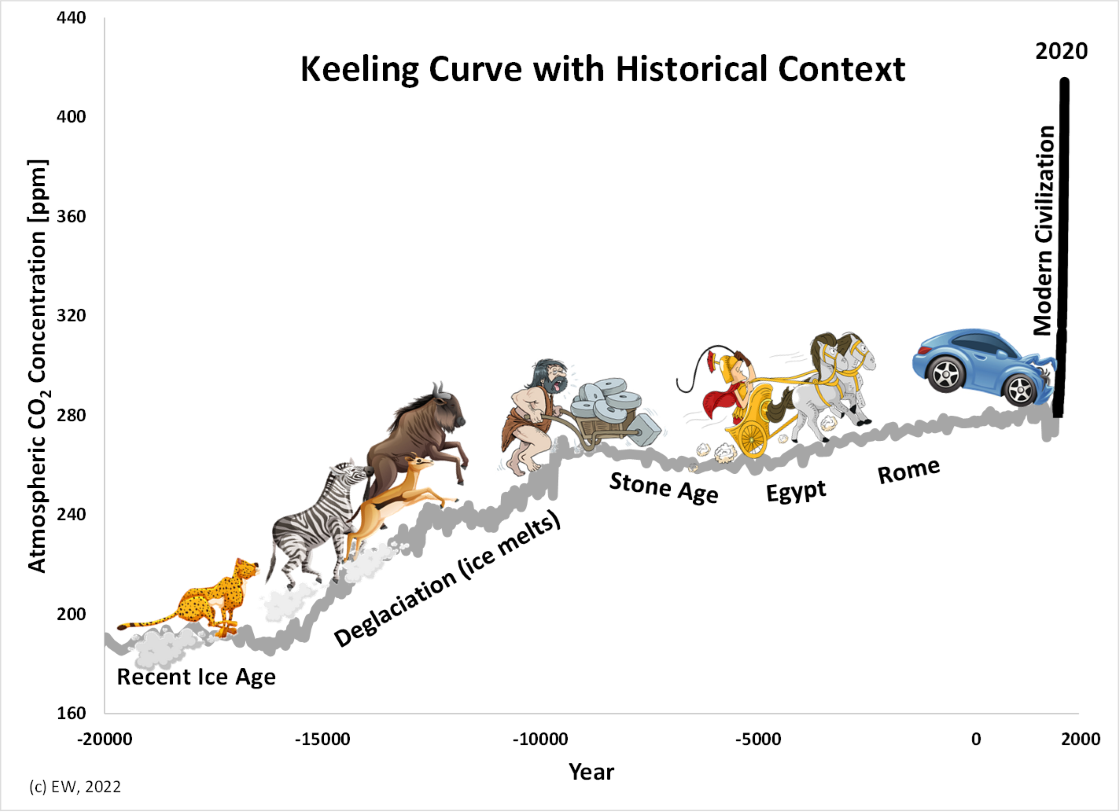
Figure 1. Rate of increase of CO2 relative to the rate during the recent deglaciation. The range of the Keeling Curve is indicated by the bracket. The animals running up the CO2 "hill" indicate that nature can adapt to this rate of change. A stable CO2 level provided a relatively stable climatic base for the development of modern civilization. Can modern civilization surmount the CO2 cliff in front of us? (Clipart licensed from iStock/skalapendra (car), iStock/blueringmedia (herd), Getty Images/zaricm (caveman), and 123RF/Lorelyn Medina (chariot))
One of the many reasons that the rate of warming matters to modern civilization is that during the relatively slow warming of the last deglaciation, there was a period when sea level rose 1 ft/10 years for a period of about 300 years or so!1 With over 200 ft of sea-level rise locked up in the world’s ice, at rates of warming even a fraction of what they are now, it is likely that we will trigger similar rates of sea-level rise. How much would we have to lower our CO2 emission rate to make them comparable to, or less, that the rates during the recent deglaciation?
We can get some idea of the scale of the problem by playing what-if scenarios with the CO2 concentrations from the start of the Industrial Revolution (i.e., roughly 1800) onward. For example, what if we could go back in time and make changes to agricultural practices, changes to industrial efficiency, and changes to the way people use power such that atmospheric CO2 concentrations increased at 1/3 the observed rate? What would that look like? Figure 2 shows such a scenario, played out until CO2 rises to about the same level it is in 2020.2 Although rising at only 1/3 the actual rate, it only takes until 2100 to get to 420 ppm CO2. The CO2 cliff appears much as it does in Fig. 1. It is simply shifted to the right by decades.

Figure 2. Rate of increase during the “Modern Civilization” era, for a rate of increase 1/3 the actual rate. Beyond 2020 the rate of increase is based on an extrapolation of the rate of increase of the Keeling Curve from 1960-2020 (the extrapolated part is shown as a dashed line).
What if we reduce the rate to 10% of the observed rate? That is, what if wind turbines, electric vehicles, and a host of other low-emission technologies had been developed soon after the Industrial Revolution, and broadly adopted, such that GHG emissions were 10% of what they actually were? Figure 3 shows the result of this exercise, plotted until CO2 rises to 420 ppm.3 Even this vastly reduced rate is still much faster than during the deglaciation cycle at the end of the recent ice age.
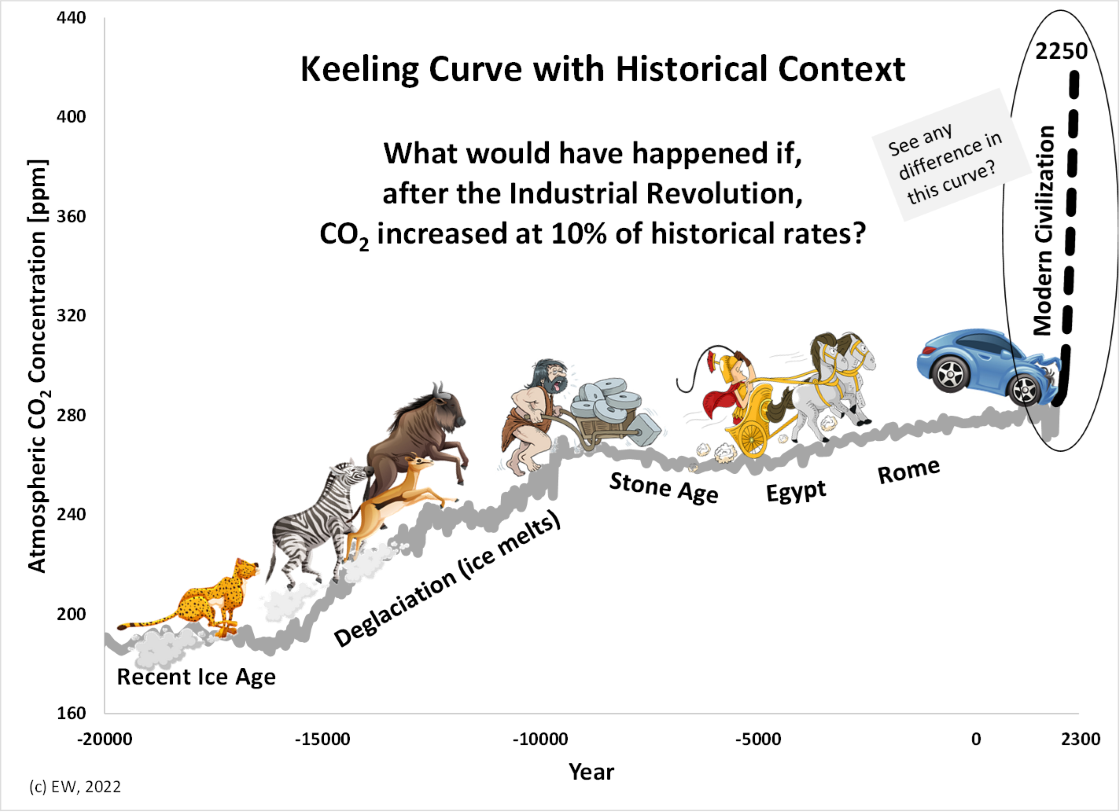
Figure 3. Rate of increase during the “Modern Civilization” era, for a rate of increase 10% the actual rate. Beyond 2020 the rate of increase is based on an extrapolation of the rate of increase of the Keeling Curve from 1960-2020 (the extrapolated part is shown as a dashed line).
Figures 1 to 3 indicate that compared to the recent deglaciation, any "reasonable" decrease in the growth rate of CO2 does not change the fact that we are running into a cliff. What the decreased rates do is to reduce the rate at which we run into the cliff. That has some benefit as a delaying action, as long as we use the delay to mitigate the effects of running into the cliff.
Think of these plots the next time somebody tries to get you excited about a 10 or 20% decrease in carbon emissions associated with this or that new technology. Think about these plots when somebody notes that the carbon emissions from burning natural gas are only 50% what they are from burning coal. Figures 2 and 3 indicate that even carbon-emission reductions of 300 to 1000%, not just from a single technology but across the entire Earth, are still inadequate to reduce the growth rate of carbon to a level to which we have confidence that the natural world and modern civilization can adapt. The only level of carbon emissions about which we have any hope for maintaining a stable, modern civilization is Net Zero carbon emissions.
Hopefully these examples give you a better feel for why climate scientists and the IPCC are stressing the need to achieve Net Zero emissions by 2050. The goal is that from 2050 on that CO2 concentrations stop rising, and maybe even decrease somewhat. But what if we don’t quite achieve Net Zero emissions by 2050? What then?
This is not a matter of all or nothing. Your smart phone is a clear example that humans are extremely creative and inventive. But we need time to develop new science and time to deploy new technology that embodies that science. Any reduction in GHG emission rates buys us much needed time to adapt to changes that are already impacting us, and to deploy solutions for minimizing future impacts. Everything you do to reduce GHG emissions buys us more time to develop and to deploy climate solutions. But ultimately, the only real solution is to achieve Net Zero emissions.
1. That is, during Meltwater Pulse 1A.
2. To extrapolate beyond 2022, the shape of the Keeling Curve was extrapolated at 1/3 the rate it increased from 1960 to 2020, until CO2 rose to 420 ppm.
3. To extrapolate beyond 2022, the shape of the Keeling Curve was extrapolated at 10% the rate it increased from 1960 to 2020, until CO2 rose to 420 ppm.
Posted by Evan on Friday, 28 January, 2022
 |
The Skeptical Science website by Skeptical Science is licensed under a Creative Commons Attribution 3.0 Unported License. |