Many hope the planned explosion of renewable energy in the 2020’s will be the first significant step towards reaching Net-Zero by 2050 and stabilizing the climate. Similar hopes were expressed when emissions dropped during the Great Recession (read here) and the Covid Pandemic Lockdown (read here). But the Keeling Curve did not notice, showing great resiliency in the face of societal upheaval. Whatever temporary emission pauses excite us, the long-term trend of the Keeling Curve is a persistent, upward bent. To appreciate the scale of the problem, consider the following characteristics of this iconic curve.
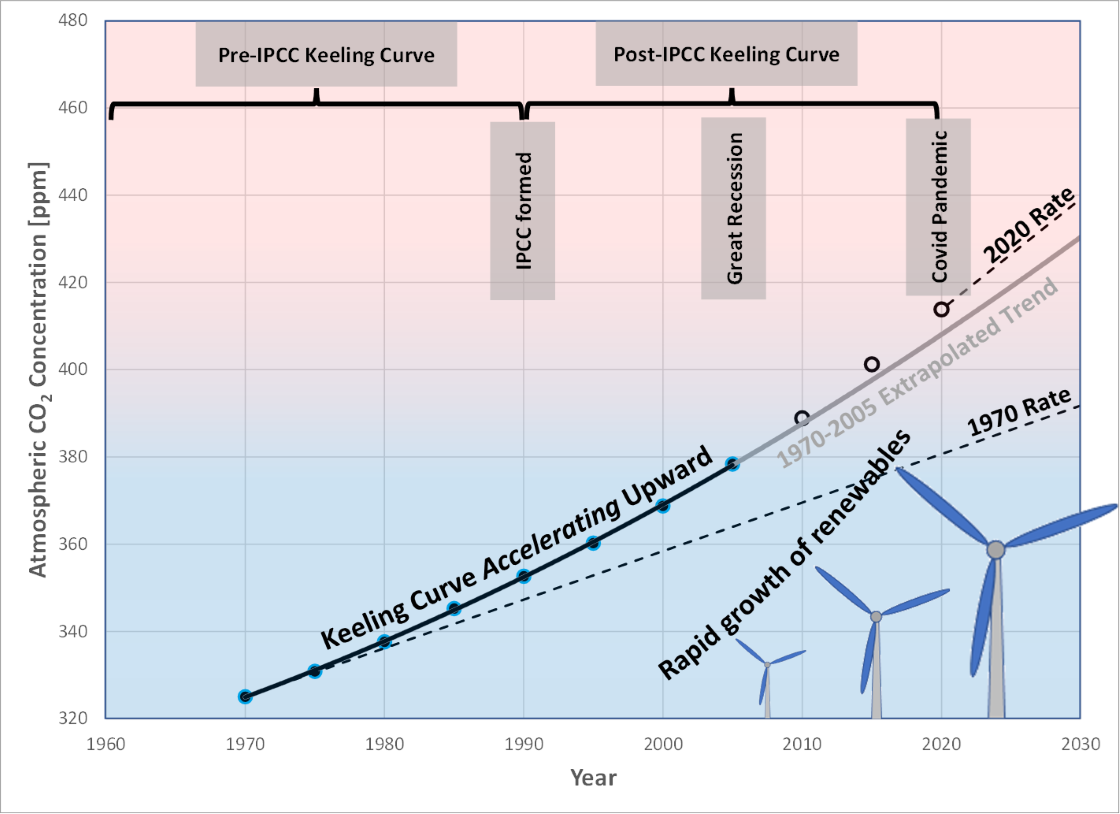
Figure 1 shows the Keeling Curve plotted from 1970 to 2005. The data points represent 10-year averages of the raw data.2 Extrapolating the 1970-2005 trend line forward, the data points for 2010, 2015, and 2020 lie above this upward-accelerating trend line.3 This implies that the 1970-2005 extrapolated Keeling Curve does not accelerate upward fast enough to explain the 2010-2020 data. That is, despite the Great Recession, the rapid growth of renewables, and the Covid Pandemic, the acceleration itself seems to be increasing! The Keeling Curve seems not to appreciate any of our efforts to slow down its rapid, upward acceleration! What will it take to impress the Keeling Curve?
Figure 1. Keeling Curve plotted from 1970 to 2020 as 10-year averages from 1970 to 2015, and a single 3-year average to represent the 2020 data. A trend line is fit to the 1970 to 2005 data, and extrapolated forward to 2030 (shown as the solid, gray line). The 1970 and 2020 rates are shown as black, dashed lines.
If the rollout of renewables in the 2020’s is to have any chance of impressing the Keeling Curve, it needs your full support: in addition to replacing fossil fuels with renewable energy, we must consume less. Think about Fig. 1 the next time you ponder the future of your children and grandchildren, so that it helps you decide how to vote with your money and your politicians. Just as you should resist those who claim all is well, “live and be happy,” resist those who project a rosy future that only requires minor adjustments to how we live, while continuing unbounded economic growth.
If we are to tame the Keeling Curve (i.e., achieve Net-Zero by 2050), we must not only stop the upward acceleration of the Keeling Curve, we must stabilize the Keeling Curve to the same kind of horizontal line that formed the basis for the emergence of modern civilization.4 So far, nothing we’ve done has impressed the Keeling Curve. Nothing.
There is a saying, “If you do what you’ve always done, you’ll get what you've always got.”
Time to do things differently.
The future is revolution. Either we proactively revolutionize how we live, or we reactively bear the brunt of revolutionary climatic changes. Our choice.
Lest you think that the problem can be easily remedied by reverting to an earlier nostalgic time when people pumped their own water, used an out-house by the barn, and did not have houses full of electronic gadgets sucking power, consider Fig. 2, which shows the annual rate of atmospheric CO2 accumulation vs global population. This plot goes back to the early 1900’s, and suggests a direct relationship between the number of people and the annual accumulation rate of CO2. There is no apparent difference in what they did versus what we’re doing. We’re just doing it on a grander scale. The upward trend seems to be ruled by one dominant factor: global population.
Figure 2 shows what the revolution needs to look like: a plunge down to achieve Net-Zero by 2050.5
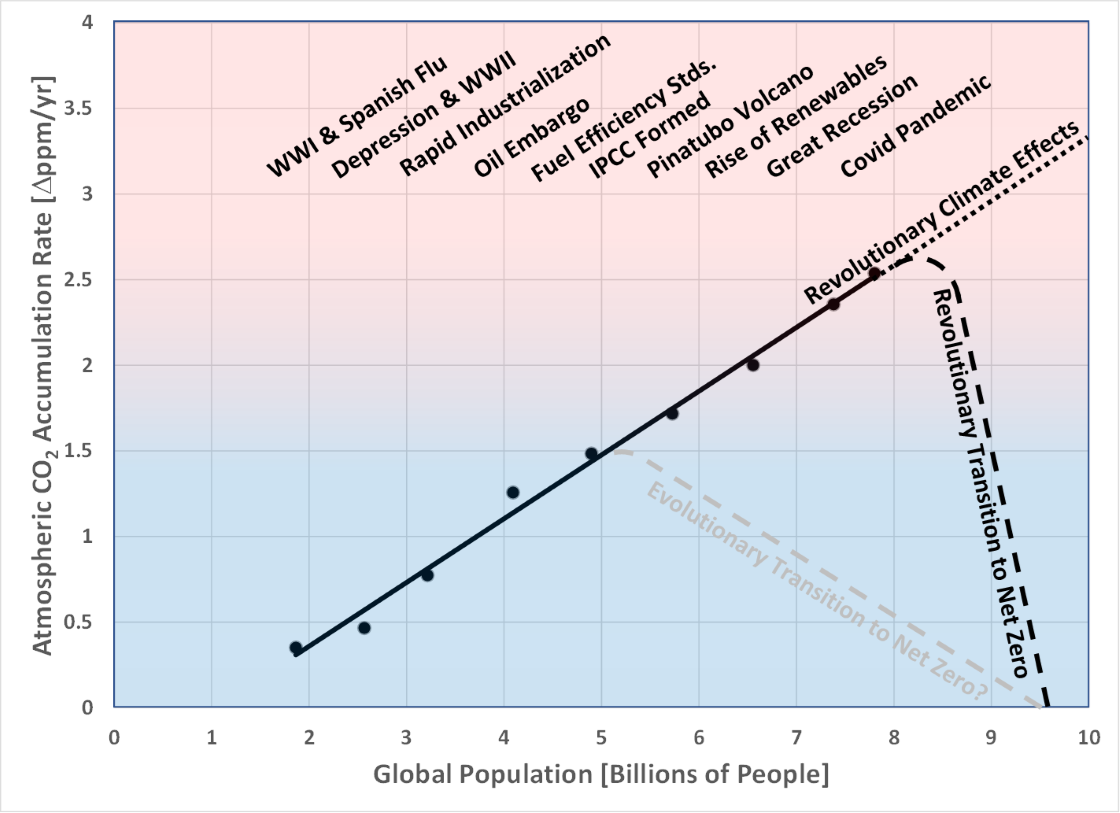
Figure 2. Annual atmospheric CO2 accumulation rates vs global population. Various notable events are shown. The dashed lines show the trend towards Net-Zero we might have followed had we started immediately after the IPCC was formed, and the trend currently proposed. This figure implicitly assumes that we will reach a global population of 9.5 billion by 2050, the target year for achieving Net-Zero.
What will it take to break the incessant upward trend and drive annual CO2 accumulation to 0? As a minimum, it will take your full involvement, as well as the commitment of enough people to elect public officials who will stay the course. This is not a sprint to Net-Zero: it is a marathon.
Monitoring our approach to Net-Zero is conceptually easy. Just measure the CO2 concentration each year and see if it stops increasing. Read here for additional information about how to monitor our approach to Net-Zero. To be successful, we need to follow something like the following path.
As of 2021 we are at 415 ppm CO2 and rising 2.5 ppm/yr. Let’s assume that we immediately start decreasing this rate by 0.1 ppm/yr. That means something like the following trend, where in 2022 we first stop the rate of increase from increasing, and in 2023 we get the CO2 accumulation rate to start dropping by 0.1 ppm/year. This looks like the trend show in Table 1.
Table 1. Path to Net-Zero by 2050.
| Year | ?CO2 [?ppm/yr] | CO2 Conc [ppm] |
| 2021 | 2.5 | 415 |
| 2022 | 2.5 | 417.5 |
| 2023 | 2.4 | 420 |
| 2024 | 2.3 | 422.4 |
| 2025 | 2.2 | 424.7 |
| 2026 | 2.1 | 426.9 |
| 2027 | 2.0 | 429 |
| 2028 | 1.9 | 431 |
| 2029 | 1.8 | 432.9 |
| 2030 | 1.7 | 434.7 |
| 2031 | 1.6 | 436.4 |
| 2032 | 1.5 | 438 |
| 2033 | 1.4 | 439.5 |
| 2034 | 1.3 | 440.9 |
| 2035 | 1.2 | 442.2 |
| 2036 | 1.1 | 443.4 |
| 2037 | 1.0 | 444.5 |
| 2038 | 0.9 | 445.5 |
| 2039 | 0.8 | 446.4 |
| 2040 | 0.7 | 447.2 |
| 2041 | 0.6 | 447.9 |
| 2042 | 0.5 | 448.5 |
| 2043 | 0.4 | 449 |
| 2044 | 0.3 | 449.4 |
| 2045 | 0.2 | 449.7 |
| 2046 | 0.1 | 449.9 |
| 2047 | Net-Zero | 450 |
This path shown in Table 1 leaves us with 450 ppm CO2 in 2050, sufficient to take us to 2°C warming. Without getting into the details here (read here for the details), the actual path to Net-Zero by 2050 requires that we not only stabilize the Keeling Curve, but get it to start decreasing. If we do that, then theoretically we can stabilize the temperature. Stabilizing the Keeling Curve will be really tough. Stabilizing global temperature will be a "bit" harder. Use Table 1 to monitor our progress.
Making this personal
A decrease from 2.5 to 2.4 is a 4% decrease the first year. But because in 2021 population is increasing about 1%/yr, this means that each person on Earth, on average, must decrease their carbon emissions by 5%/yr to compensate for the carbon emissions of the newborns. By some estimates, 25% of the world need assistance to rise up out of poverty. Not only do they lack the reserves to cut their carbon emissions, but they deserve the chance to rise to a higher standard of living. If we reduce our emissions sufficiently to cover their lack of ability to reduce emissions, and then reduce our emissions further so that they can rise up out of poverty, those in developed countries need to decrease their emissions about 8% the first year, and the same amount year after year after year.
What does this mean? If you drive a car 15,000 miles/yr, that means driving 1200 miles less the first year, 1200 miles less the second year, etc. At some point you need to buy a car with much higher mileage. You need to buy 8% fewer clothes the first year, and then 8% fewer the next year, etc. Or buy clothes with a lower carbon footprint and wear them longer. Eat 8% less each year, or eat food with a lower carbon footprint. Heat and cool your house 8% less the first year, or insulate your house better and install a more efficient heating/cooling system. Because there is a limit to how much we can reduce our emissions, at some point we accept that we will continue emitting some carbon and build systems to remove carbon from the atmosphere to compensate for our baseline emissions. These are collectively called Negative Emissions Technologies (NET).
Where does this take us?
If we get the entire world on board with this carbon-reduction plan so that we successfully implement the carbon-emission-reduction schedule shown in Table 1, this represents a total increase of 35 ppm CO2 relative to the 2021 level of 415. That means that by 2050 we will have 450 ppm CO2 in the atmosphere, enough to take us to 2°C warming … even with a revolutionary decrease to Net-Zero by 2050.
What does this mean? We are at the gates of Hell. Anything less than a revolutionary approach to decarbonization and we will enter a place we've only dreamed of. Is this the future you want for your children and grandchildren?
The future is either about revolutionary changes to how we run society, or adaptation to revolutionary climatic changes. Time to choose. Time to act!
1. Referring to a talk by the same name given by Prof. Kevin Anderson in 2015.
2. The data point for 2020 is a 3-year average of the raw data from 2019, 2020, and 2021.
3. For those concerned about extrapolating a quadratic equation, the R2 = 0.9998 for the trend line fit to the 10-yr averaged data from 1970 to 2005.
4. Some use a definition of Net-Zero to mean that our Net GHG emissions reach 0, a goal that is virtually impossible to verify. For this post I define Net-Zero to mean that the net, annual accumulation rate of CO2 in the atmosphere reaches 0, a goal that is easily verified. Read here for more details about the distinction between these two definitions of Net-Zero.
5. Whereas some project a global population of 9 billion people by 2050 and others 10 billion, I’ve used a value between these two of 9.5 billion people.
Posted by Evan on Friday, 4 March, 2022
 |
The Skeptical Science website by Skeptical Science is licensed under a Creative Commons Attribution 3.0 Unported License. |