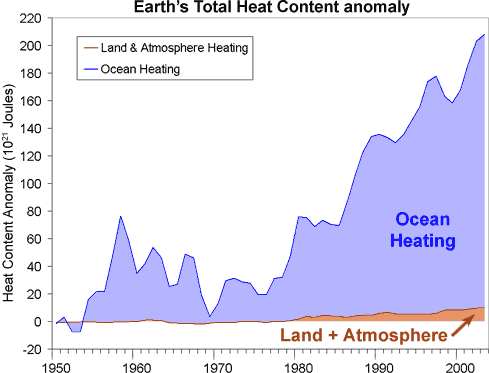
Figure 1: Total Earth Heat Content from 1950 (Murphy 2009). Ocean data taken from Domingues et al 2008.
Skeptics proclaim that global warming stopped in 1998. That we're now experiencing global cooling. However, these arguments overlook one simple physical reality - the land and atmosphere are only one small fraction of the Earth's climate (albeit the part we inhabit). Global warming is by definition global. The entire planet is accumulating heat due to an energy imbalance. The atmosphere is warming. Oceans are accumulating energy. Land absorbs energy and ice absorbs heat to melt. To get the full picture on global warming, you need to view the Earth's entire heat content.
This analysis is performed in An observationally based energy balance for the Earth since 1950 (Murphy 2009) which adds up heat content from the ocean, atmosphere, land and ice. To calculate the Earth's total heat content, the authors used data of ocean heat content from the upper 700 metres. They included heat content from deeper waters down to 3000 metres depth. They computed atmospheric heat content using the surface temperature record and the heat capacity of the troposphere. Land and ice heat content (eg - the energy required to melt ice) were also included.

Figure 1: Total Earth Heat Content from 1950 (Murphy 2009). Ocean data taken from Domingues et al 2008.
A look at the Earth's total heat content clearly shows global warming has continued past 1998. So why do surface temperature records show 1998 as the hottest year on record? Figure 1 shows the heat capacity of the land and atmosphere are small compared to the ocean (the tiny brown sliver of "land + atmosphere" also includes the heat absorbed to melt ice). Hence, relatively small exchanges of heat between the atmosphere and ocean can cause significant changes in surface temperature.
In 1998, an abnormally strong El Nino caused heat transfer from the Pacific Ocean to the atmosphere. Consequently, we experienced above average surface temperatures. Conversely, the last few years have seen moderate La Nina conditions which had a cooling effect on global temperatures. And the last few months have swung back to warmer El Nino conditions. This has coincided with the warmest June-August sea surface temperatures on record. This internal variation where heat is shuffled around our climate is the reason why surface temperature is such a noisy signal.
Figure 1 also underscores just how much global warming the planet is experiencing. Since 1970, the Earth's heat content has been rising at a rate of 6 x 10²¹ Joules per year. In more meaningful terms, the planet has been accumulating energy at a rate of 190,260 GigaWatts. Considering a typical nuclear power plant has an output of 1 GigaWatt, imagine 190,000 nuclear power plants pouring their energy output directly into our oceans.
Figure 1 only goes as far as 2003 as the ocean heat data used (Domingues 2008) only goes that far. What has global warming been doing since then? Since 2003, ocean heat data has been measured by the newly deployed Argo network. However, there have been teething problems with the Argo buoys experiencing pressure sensor issues that impose a cooling bias on the data. Consequently there have been several data analyses on ocean heat since 2003. One reconstruction of ocean heat show cooling since 2003 (Willis 2008). Other analyses of the Argo data show ocean warming (Levitus 2009, Leuliette 2009, Cazenave 2009).
How do we determine which analyses are more accurate? Ocean heat data can also be independently determined through other empirical means. Cazenave 2009 uses satellite gravity measurements to create two independent estimates of ocean heat - both find warming. Sea level has been inexorably rising since 2003. As a large portion of sea level rise is due to thermal expansion from ocean warming, this is an indirect confirmation of warming.
Lastly, the planet's energy imbalance is confirmed by satellite measurements of incoming and outgoing radiation. Earth's Global Energy Budget (Trenberth 2009) examines satellite measurements for the Mar 2000 to May 2004 period and finds the planet is accumulating energy at a rate of 0.9 ± 0.15 W m?2. This is consistent with the amount of heat accumulating in the ocean. Preliminary analysis on the latest CERES satellite data shows an increasing energy imbalance from 2004 to the end of 2008 (although this data is yet to be published, more on this later).
So the point to remember when considering short term cooling trends in surface temperature records is that the atmosphere is only one small part of a planet which is in energy imbalance. Empirical measurements show the planet continues to accumulate heat. More energy is coming in than is radiating back out to space. Global warming continued past 1998 and is still happening.
Acknowledgements: Many thanks to Dan Murphy for graciously sharing his heat content data and John Cross for his comments and advice.
Posted by John Cook on Monday, 28 September, 2009
 |
The Skeptical Science website by Skeptical Science is licensed under a Creative Commons Attribution 3.0 Unported License. |