After a spectacular burst of rapid intensification, Hurricane Helene made landfall just east of the mouth of the Aucilla River, about 10 miles west-southwest of Perry, Florida, at about 11:10 p.m. EDT Thursday. Top sustained winds were estimated at 140 mph, making Helene a Category 4 hurricane at landfall. We’ll have much more on Helene’s many impacts—some still unfolding on Friday—in our next Eye in the Storm post.

Helene’s landfall gives the U.S. a record eight Cat 4 or Cat 5 Atlantic hurricane landfalls in the past eight years (2017-2024), seven of them being continental U.S. landfalls. That’s as many Cat 4 and 5 landfalls as occurred in the prior 57 years. The only comparable beating the U.S. has taken from Category 4 and 5 landfalling hurricanes occurred in the six years from 1945 to 1950, when five Category 4 hurricanes hit South Florida.

With the U.S. taking such a beating from extreme hurricanes in recent years, it’s worth reviewing how climate change is contributing to making hurricanes worse.

Landfalling U.S. Cat 4s and 5s

The eight Cat 4 and 5 landfalls since 2017: Harvey (2017 in Texas), Irma (2017 in Florida), Maria (2017 in Puerto Rico), Michael (2018 in Florida), Laura (2020 in Louisiana), Ida (2021 in Louisiana), Ian (2022 in Florida), Helene (2024 in Florida).

The eight Cat 4 and 5 landfalls in the prior 57 years: Charley, 2004; Andrew, 1992; Hugo, 1989; Celia, 1970; Camille, 1969; Betsy, 1965; Carla, 1961; Donna, 1960.

Climate change makes the strongest hurricanes stronger

Hurricanes are heat engines that take heat energy out of the ocean and convert it to the kinetic energy of their winds. A hotter ocean will allow hurricanes to grow more powerful, assuming that the other factors that power hurricanes, including low wind shear and a moist atmosphere, are present.

table showing the exponential growth in damage as hurricane wind speeds increase
Figure 1. Damage multiplier for hurricane winds compared to a minimal Category 1 hurricane with 75 mph winds. The difference in damage potential between each Saffir-Simpson category is roughly a factor of four. (Image credit: NOAA)

As far back as 1987, MIT hurricane scientist Kerry Emanuel theorized that the wind speeds in hurricanes can be expected to increase about 5% for every increase of one degree Celsius (1.8°F) in tropical ocean temperature, assuming that the average wind speed near the surface of the tropical oceans does not change. Computer modeling has found a slightly smaller magnitude (4%) for the increase.

A 4-5% increase in hurricane winds may not seem like a big deal, but damage from a hurricane increases exponentially with an increase in winds. For example, according to NOAA, a Category 2 hurricane with 100 mph (161 kph) winds will do 10 times the damage of a Category 1 hurricane with 75 mph (121 kph) winds. This includes damage not only from winds but also from storm surge, inland flooding, and tornadoes. Bottom line: A 4-5% increase in winds yields about a 40-50% increase in hurricane damage (Figure 1).

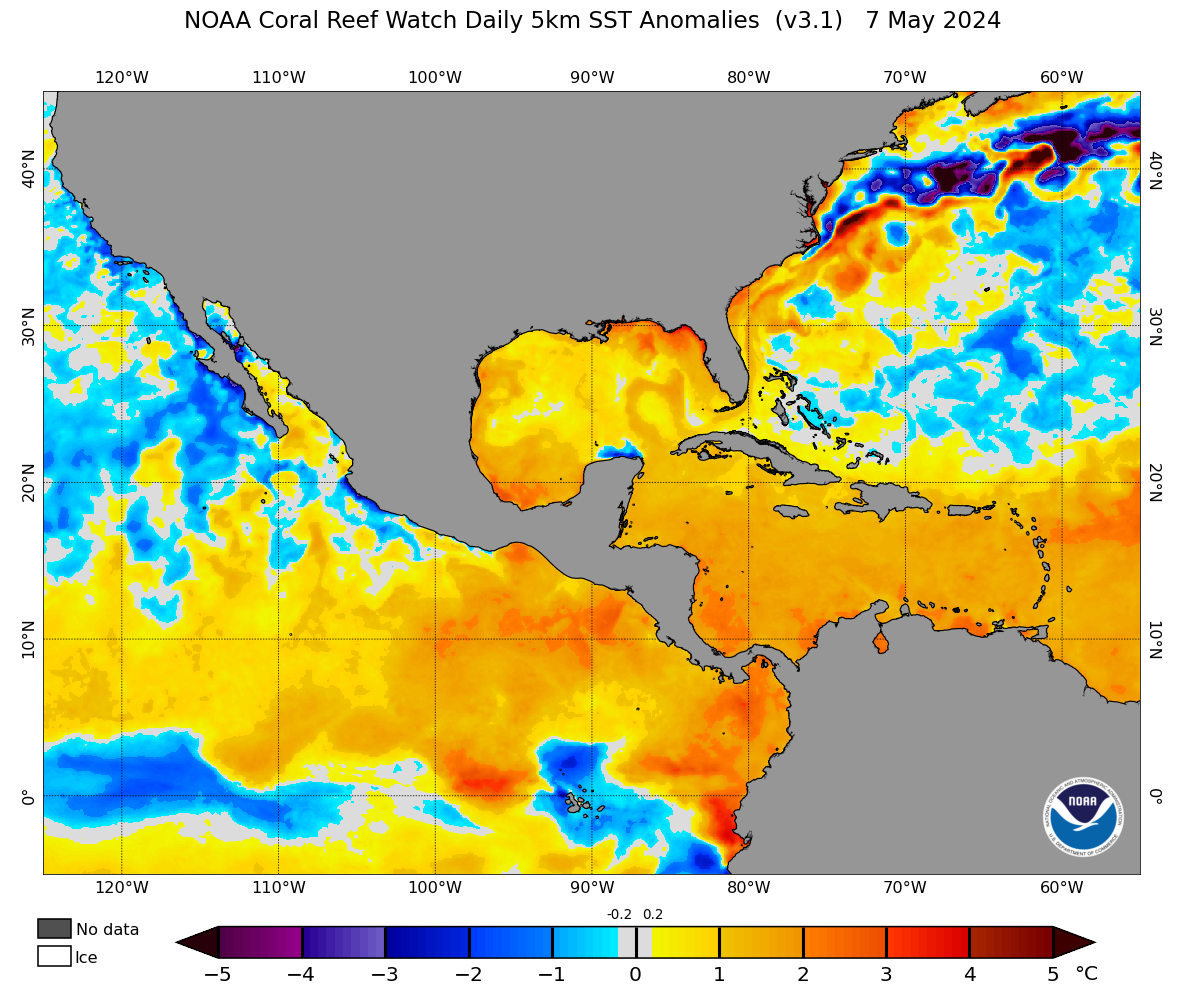
According to NOAA’s Coral Reef Watch, sea surface temperatures along Helene’s path through the western Caribbean and eastern Gulf of Mexico were about 1-2 degrees Celsius (1.8-3.6°F) above the long-term average. Using the theoretical results above, this increase in sea surface temperatures equated to a 50-100% increase in Helene’s destructive power.

Not all of this year’s unusual warmth in the Gulf of Mexico can be confidently attributed to human-caused global warming. If we restrict ourselves to looking at just the long-term trend in August sea surface temperatures in the Gulf, these have warmed about 0.9 degree Celsius (1.62°F) per century, and 1.0 degree Celsius since 1910, according to NOAA (Fig. 2), which is close to about a 1.3-degree Celsius increase since preindustrial times (using the year 1880 as a reference). That is similar to the long-term trend for the global oceans, which have warmed about 1 degree Celsius since preindustrial times in the late 1800s.

Fig 2
Figure 2. Departure of August sea surface temperature from average over the Gulf of Mexico, 1910-2024. (Image credit: NOAA)

It thus appears reasonable to theorize that increased sea surface temperatures of about 1 degree Celsius since 1910 in the Gulf of Mexico from human-caused global warming led to about a 40-50% increase in Helene’s destructive power, all else being equal, by increasing the hurricane’s winds by at least 4-5%. This could well be an underestimate of the influence of human-caused climate change on the record-warm sea surface temperatures in the Gulf, since the unusual atmospheric circulation patterns responsible for the hot and low-wind conditions experienced there over the past two years, which contributed to the record sea surface temperatures, could have had a climate change connection.

Global warming increases hurricane rainfall

One of the more confident predictions we can make for hurricanes in the future is that they will dump more rain. Global warming increases the rate at which ocean water evaporates into the air, and increases the amount of water vapor the atmosphere contains when fully saturated. This result is about 7% more water vapor in saturated air for every 1°C of ocean warming. This increase in atmospheric water vapor can cause a much larger increase in hurricane rainfall than one might surmise, since water vapor retains the heat energy that was required to evaporate the water, and when the water vapor condenses into rain, this latent heat is released. The extra heat helps power the hurricane, making it larger and more intense, allowing it to pull in water vapor from an even larger area and thus dump more rain.

Modeling studies on average project an increase on the order of 10-15% for rainfall rates averaged within about 100 km of hurricanes for a 2-degree-Celsius global warming scenario. Hurricane Harvey of August 2017 brought the greatest rainfall event ever recorded in the U.S. by a tropical cyclone — peaking with an astonishing 60.58 inches in Nederland, Texas. The resulting flood disaster was the second-costliest weather-related disaster in U.S. and world history — $160 billion, according to NOAA. At least four papers have been published that found that human-caused global warming significantly increased the odds of heavy rains such as those Hurricane Harvey brought to Texas.

Climate change causes more rapidly intensifying hurricanes

faster
As discussed in detail in our 2020 post, rapidly intensifying hurricanes like Helene, Ida, Michael, Laura, and Harvey that strengthen just before landfall are among the most dangerous storms as they can catch forecasters and populations off guard, risking inadequate evacuation efforts and large casualties. Unfortunately, not only is human-caused climate change making the strongest hurricanes stronger, but it is also making dangerous rapidly intensifying hurricanes like Helene more common.


According to research published in 2019 in Nature Communications, “Recent increases in tropical cyclone intensification rates,” Atlantic hurricanes showed “highly unusual” upward trends in rapid intensification during the period 1982–2009, trends that can be explained only by including human-caused climate change as a contributing cause. The largest change occurred in the strongest 5% of storms: For those, 24-hour intensification rates increased by about 3-4 mph per decade between 1982 and 2009.

Helene is one of just 10 historical storms since 1950 that have rapidly intensified by at least 40 mph in the 24 hours before landfall (using data from the regular six-hourly fix just before landfall, data from the actual landfall point, or in the case of Hurricane King of 1950, the point one hour after landfall). It is sobering to see that five of those storms, below in boldface, occurred in the past seven years.

Rapidly intensifying tropical cyclones since 1950

Humberto, 2007 (65 mph increase)
Ida, 2021 (60 mph increase)
King, 1950 (60 mph increase)
Helene, 2024 (55 mph increase)
Laura, 2020 (45 mph increase)
Michael, 2018 (45 mph increase)
Harvey, 2017 (40 mph increase)

Cindy, 2005 (40 mph increase)
Danny, 1997 (40 mph increase)
Eloise, 1975 (40 mph increase)

Sea level rise increases storm surge damage

Fig 3
Figure 3. Human-caused global warming has helped sea level at St. Petersburg, Florida, rise at a rate of about 0.3 meters (1.0 feet) per century, making it much easier to set new all-time high-water records. (Image credit: NOAA)

Of the six tide gauges with long-term periods of record along the west coast of Florida, Helene set an all-time high water record at three of them (Cedar Key, Clearwater Beach, and St. Petersburg) – in all three cases just before or just after midnight Thursday night – and came in second or third place behind Hurricane Ian of 2022 and Hurricane Irma of 2017 at the other two (Ft. Myers and Naples). Sea level rise made these records easier to set. Sea level rise since 1947 at the St. Petersburg, Fla., tide gauge has been about 3.09 mm per year, or about 0.3 meters (1.0 feet) if extrapolated to a 100-year period (Figure 1). A substantial portion of this sea level rise is the result of human-caused global warming; the global sea level rise since 1900 is estimated to be about 7.5 inches (0.19 meters). Most of this rise has occurred because of melting of glaciers and because water expands when heated. Over the past 10 years, sea level rise has accelerated along the Florida coast, and the rate has been about 7 mm per year (2.3 feet per century) at St. Petersburg. Changes in ocean circulation and wind patterns, with climate change a potential contributing factor, are thought to be the reason for the acceleration.

Six of St. Petersburg’s top-10 water levels since 1947 (highlighted in bold) have occurred since 2012. This is the kind of behavior one would expect to see in an era of climate change, since sea level rise makes it easier to set new high-water records. Here are the top ten water levels at St. Petersburg since 1947, as measured above mean higher high water, or MHHW:

  1. 6.31 feet, September 27, 2024, Hurricane Helene
  2. 4 feet, August 31, 1985, Hurricane Elena
  3. 3.8 feet, August 30, 2023, Hurricane Idalia
  4. 3.58 feet, October 8, 1996, Tropical Storm Josephine
  5. 3.52 feet, June 18, 1982, Subtropical Storm One
  6. 3.37 feet, November 12, 2020, Tropical Storm Eta
  7. 3.16 feet, December 17, 2023, Winter storm
  8. 2.74 feet, September 6, 2004, Hurricane Frances
  9. 2.91 feet, March 13, 1993, Storm of the Century
  10. 2.74 feet, June 25, 2012, Tropical Storm Debby

Here are the top seven water levels at Cedar Key since 1914 (above mean higher high water, or MHHW), again with records set since 2012 in bold:

1) 9.3 feet, September 27, 2024, Hurricane Helene
2) 6.84 feet, August 30, 2023, Hurricane Idalia

3) 5.98 feet, September 2, 2016, Hurricane Hermine
4) 5.41 feet, August 31, 1985, Hurricane Elena
5) 5.15 feet, October 8, 1996, Tropical Storm Josephine
6) 5.13 feet, March 13, 1993, Storm of the Century
7) 4.66 feet, August 5, 2024, Hurricane Debby

Here are the top six water levels at the Clearwater Beach tide gauge, on the Gulf of Mexico side of St. Petersburg, where records extend back to 1973:

1) 6.67 feet, September 26, 2024, Hurricane Helene
2) 4.02 feet, March 13, 1993, Storm of the Century
3) 3.58 feet, August 30, 2023, Hurricane Idalia
4) 3.32 feet, January 3, 1999, Winter storm
5) 3.17 feet, August 31, 1985, Hurricane Elena
6) 2.91 feet, October 8, 1996, Tropical Storm Josephine

Here are the top seven water levels at Naples since 1965 (above mean higher high water, or MHHW):

1) 6.18 feet, September 28, 2022, Hurricane Ian (gage failed before highest level was recorded)
2) 4.02 feet, September 10, 2017, Hurricane Irma

3) 4.01 feet, September 26, 2024, Hurricane Helene
4) 3.11 feet, August 4, 2024, Hurricane Debby (data from the new North Naples Bay station)
5) 3.11 feet, December 22, 1972, Winter storm
6) 3.08 feet, January 17, 2016, Winter storm
7) 3.02 feet, September 28, 2023, Hurricane Idalia

Helene brought the second-highest water level on record to Fort Myers, Florida, where accurate records go back to 1965. Here are their top seven water levels (above mean higher high water, or MHHW):

1) 7.26 feet, September 28, 2022, Hurricane Ian
2) 5.12 feet, September 27, 2024, Hurricane Helene
3) 3.41 feet, November 23, 1988, Tropical Storm Keith
4) 3.31 feet, September 14, 2001, Hurricane Gabrielle
5) 3.30 feet, June 18, 1982, Unnamed subtropical storm
6) 3.27 feet, August 4, 2024, Hurricane Debby
7) 3.2 feet, August 30, 2023, Hurricane Idalia

Note that there were multiple reports of inundations from 1960’s Hurricane Donna of eight to 12 feet in the Naples area and seven to 11 feet in the Fort Myers area.