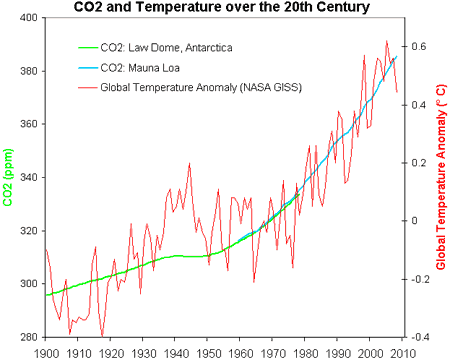
Figure 1: CO2 green line derived from ice cores obtained at Law Dome, East Antarctica (CDIAC). CO2 blue line measured at Mauna Loa (NOAA). Global temperature anomaly (GISS)
Previously, we looked at the correlation between CO2 and temperature over the past 40 years. However, as I'm always saying, you need to look at the broader view, not just a single piece of the puzzle. The 40 year period was chosen to demonstrate that even during a period of long term warming, internal variability causes periods of short term cooling. What if we look at a longer time series? Over the past century, are there any periods of long term cooling and if so, what is the significance?

Figure 1: CO2 green line derived from ice cores obtained at Law Dome, East Antarctica (CDIAC). CO2 blue line measured at Mauna Loa (NOAA). Global temperature anomaly (GISS)
Figure 1 compares CO2 to global temperatures over the past century. The first thing to clarify is that the relationship between CO2 and global temperature is not linear. As more CO2 is added, the warming effect has a diminishing return. Hence, the relationship between CO2 and temperature is logarithmic, not linear. A more appropriate comparison with CO2 is radiative forcing.
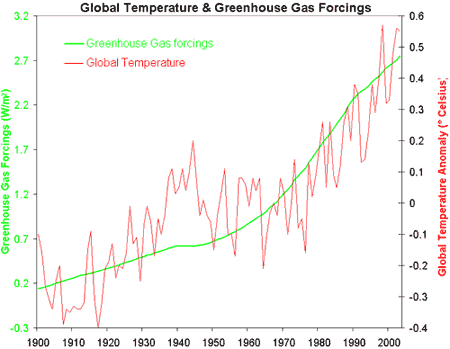
Radiative forcing is loosely described as the change in net energy flux at the top of the Earth's atmosphere. Eg - the change in how much energy the planet is accumulating or losing. The relationship between global temperature anomaly and radiative forcing is linear. Figure 2 compares greenhouse gas forcing (which is predominantly due to CO2 but includes smaller contributions from CH4, N2O and CFC) to global temperature anomaly.

Figure 1: Greenhouse gas forcing (GISS) and global temperature anomaly (GISS).
In truth, Figure 1 and Figure 2 both paint a similar picture. While CO2 is rising from 1940 to 1970, global temperatures show a cooling trend. This is a 30 year period, longer than can be explained by internal variability from ENSO and solar cycles. If CO2 causes warming, why isn't global temperature rising over this period?
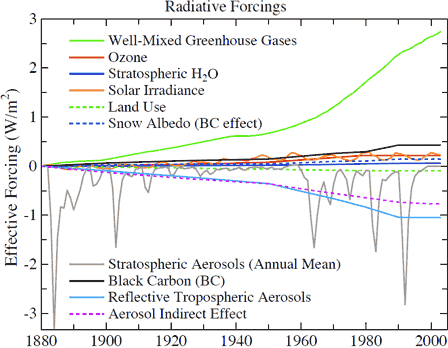
The broader picture in this scenario is to recognise that CO2 is not the only factor that influences climate. There are a number of forcings which affect the net energy flux into our climate. Stratospheric aerosols (eg - from volcanic eruptions) reflect sunlight back into space, causing net cooling. When solar activity increases, the net energy flux increases. Figure 3 shows a composite of the various radiative forcings that affect climate.

Figure 2: Separate global climate forcings relative to their 1880 values (image courtesy NASA GISS).
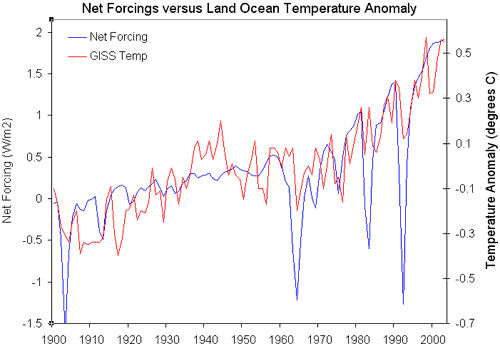
When all the forcings are combined, the net forcing shows good correlation to global temperature. There is still internal variability superimposed on the temperature record due to short term cycles like ENSO. The main discrepancy is a decade centered around 1940. This is thought to be due to a warming bias introduced by US ships measuring engine intake temperature.

Figure 3: Net forcing (Blue - NASA GISS) versus global land ocean temperature anomaly (Red - GISS Temp).
So we see that climate isn't controlled by a single factor - there are a number of influences that can change the planet's radiative balance. However, for the last 35 years, the dominant forcing has been CO2.
Posted by John Cook on Thursday, 18 June, 2009
 |
The Skeptical Science website by Skeptical Science is licensed under a Creative Commons Attribution 3.0 Unported License. |