Human-caused climate change is unmistakably distinct from Earth’s natural climate variability
This is a re-post from Staying Curious by Dean Rovang
This post presents two figures that are the culmination of an extended effort to build the strongest possible empirical case for what the paleoclimate record shows about CO? and temperature. They draw on five independent regression fits across four independent archives and 66 million years of geological evidence. The argument stands on its own merits.
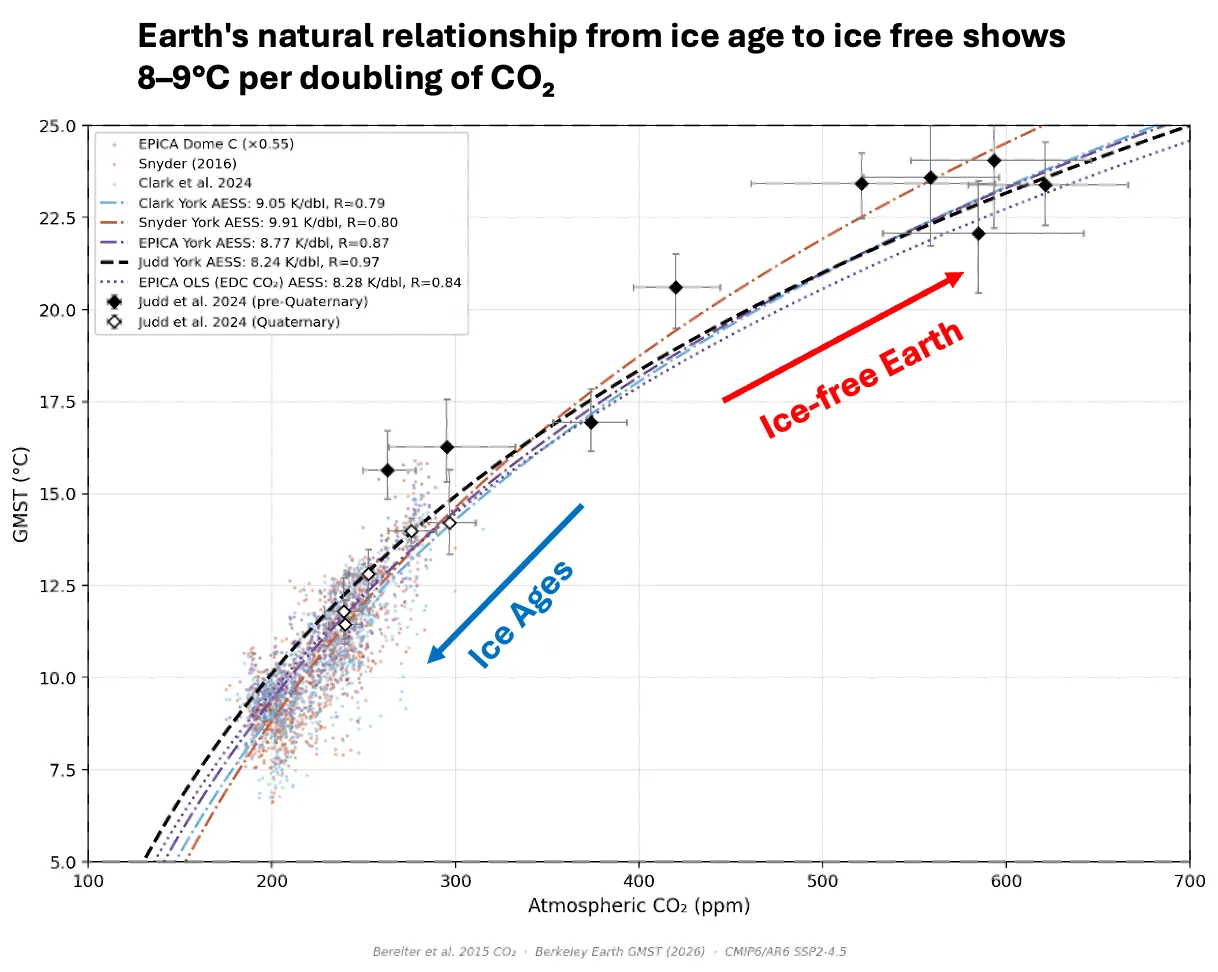
Figure 1. Earth’s natural CO?–temperature relationship across three independent Pleistocene reconstructions and the Judd et al. (2024) deep-time geological record. Five fits — four York/ODR regressions and the canonical EPICA OLS fit — all land between 8.24 and 9.91 K/doubling. Solid black diamonds: pre-Quaternary Cenozoic stages from Judd et al. (2024). Open diamonds: Quaternary stages. CO? from Bereiter et al. (2015). GMST anchored to Berkeley Earth 1850 (13.83°C).
Three completely independent temperature reconstructions — the EPICA (European Project for Ice Coring in Antarctica) Dome C ice core, the Snyder (2016) Bayesian stack of 61 marine sediment cores, and the Clark et al. (2024) area-weighted reconstruction of 111 marine sediment cores — are plotted against the same CO? record on common axes. All three share Bereiter et al. (2015) as their CO? source, the best available composite for this period. The geological stages from Judd et al. (2024) extend the record to 66 million years.
Five regression fits are shown. Four use York/ODR regression — the method that accounts for measurement uncertainty in both CO? and temperature simultaneously, and the method used by Judd et al. themselves. The fifth is the canonical EPICA OLS fit using the original EDC CO? source, included because it was the first fit introduced relative to the Judd curve and remains the most conservative estimate in the set. All five land between 8.24 and 9.91 K/doubling of CO? — the same tier regardless of dataset, CO? source, or regression method.
The figure spans Earth’s climate from deep ice ages — CO? near 175 ppm, global temperatures near 8°C — to the warm Cenozoic periods when there were no significant continental ice sheets and sea levels were 60–70 meters higher. A natural question is whether the ice-albedo feedback drives this slope — and whether it therefore only applies to glaciated climates. The figure addresses this directly: most of Judd’s data comes from greenhouse climates with little or no continental ice — the Eocene, Oligocene, early Miocene — yet the same slope holds across the full range. If ice-albedo were the dominant driver, the relationship should look different in ice-free regimes. It does not, which Judd et al. themselves describe as surprising. The relationship appears to be a fundamental property of the Earth system across a wide range of boundary conditions, with and without ice sheets.
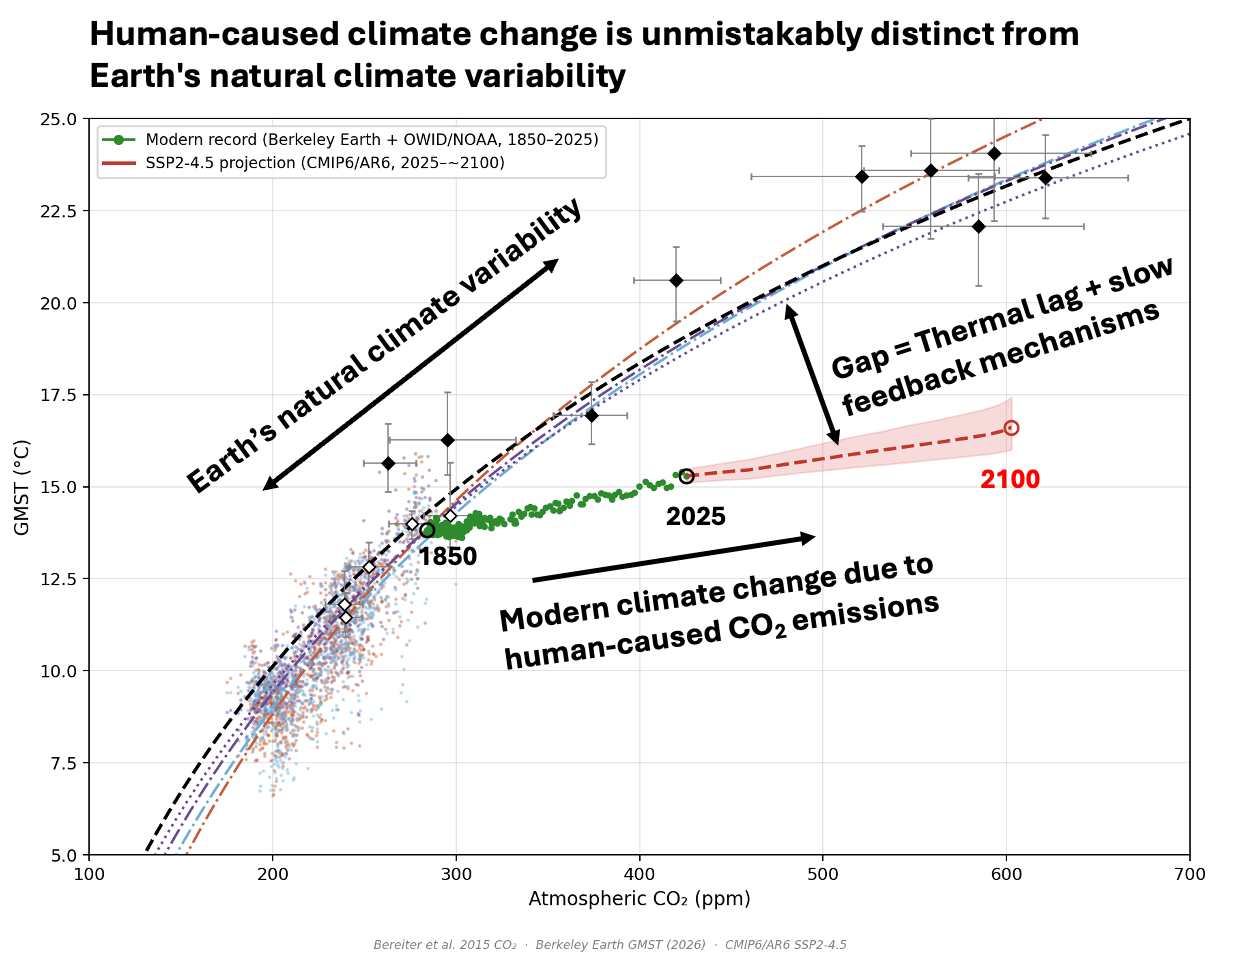
Figure 2. The same natural CO?–temperature relationship as Figure 1, with the modern instrumental record (green, Berkeley Earth + OWID/NOAA, 1850–2025) and SSP2-4.5 projection (red, CMIP6/AR6, 2025–∼2100) added. Open circles mark 1850, 2025, and ∼2100. The gap between the modern trajectory and the natural equilibrium fits reflects thermal lag and slow feedback mechanisms — not a change in the underlying physics.
Figure 2 adds the modern instrumental record and the SSP2-4.5 projection to the same axes. At 1850, the modern record begins exactly where the natural relationship sits — the hinge point where Earth’s climate history meets direct measurement. From there, CO? rises rapidly while temperature lags behind, driving the system into a region of CO?–temperature space with no analog in the natural record.
The gap between the modern trajectory and the natural equilibrium fits is labeled directly on the figure: thermal lag and slow feedback mechanisms. The fits in Figure 1 reflect the apparent Earth System Sensitivity (AESS) — Judd et al.’s term for the empirical CO?–temperature relationship across states where all feedbacks, including slow ones like ice sheets, vegetation changes, and carbon cycle responses, have had time to fully operate. Those slow feedbacks operate on timescales of millennia, not centuries. The gap is not a simple warming commitment. It is the distance between where the system currently sits and where the physics ultimately points, given enough time.
The figure also raises the question of reversibility — one of the most important questions in climate science. Will the system eventually return to the equilibrium curve? If so, where on the curve? How long after net-zero emissions is reached? What is the path, and what are the impacts along the way? The system will tend toward the equilibrium curve as long as CO? remains elevated, but the journey operates on geological timescales. The destination on the curve is determined by the CO? concentration at which the system eventually stabilizes — which is precisely why the timing of net-zero matters so profoundly. Sea level rise, driven by slow ice sheet dynamics, will continue for centuries regardless of when emissions reach zero. These are not hypothetical futures — they are physical consequences already set in motion.
The modern trajectory does not move toward the equilibrium curve. At any given CO? concentration, the gap keeps growing as CO? rises faster than temperature can follow. The only way to stop that gap from growing is to reach net-zero CO? emissions. The longer it takes to get there, the higher the CO? concentration at which the system stabilizes — and the higher the equilibrium temperature the physics ultimately points to. Clark et al. (2016) showed that decisions made in the next few decades will lock in sea level rise, ice sheet loss, and temperature change that persist for thousands of years — well beyond any planning horizon human civilization has ever contemplated. The equilibrium curve does not forget where we sent it. The physics does not negotiate on timeline. It only responds to what is in the atmosphere.
Five independent fits of Earth’s natural CO?–temperature relationship — derived from different archives, different methods, and different timescales — all land in the same tier. That relationship holds from the depths of the ice ages to warm greenhouse climates with no continental ice, across 66 million years of Earth history. The modern trajectory departs from it at 1850 and has not looked back. The departure is not subtle, not a matter of interpretation, and not an artifact of any single dataset or method. It is unmistakable.
Full sources in the preceding post: justdean.substack.com/p/unprecedented-in-66-million-years
Clark et al. (2016). Nature Climate Change, 6, 360–369. https://doi.org/10.1038/nclimate2923
Posted by Guest Author on Tuesday, 14 April, 2026