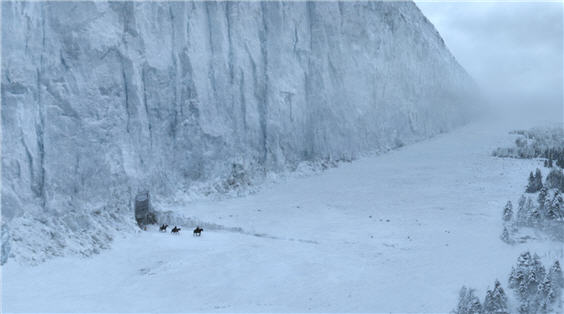
HBO’s new mega-series A Game of Thrones (‘The Sopranos in Middle Earth’ according to the marketing people) shows a stupendous wall of ice:

Figure 1 - The Wall, copyright HBO
In the story, people piled up 5 billion tons of ice over 300 miles to keep their lands safe from the dangers to the North. Our own northern ice also keeps our lands safe, but just how sturdy is it?
The trillions of tons of ice loss in Greenland since 2000 has been well discussed, but its baby brothers in the Canadian Arctic Archipelago (CAA) are still quite hefty and we haven’t heard much about them specifically. A recent Nature article by Gardner et al is a great summary.

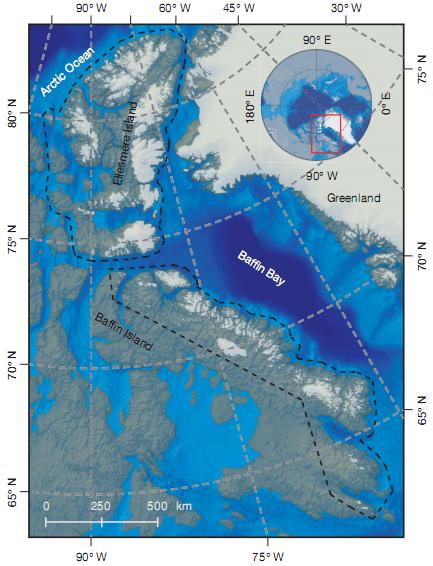
Figure 2 - Ellesmere Island and Baffin Island, the areas measured by Gardner et al 2011
The scientists wanted to determine how much ice the islands were gaining or losing and used several independent methods. For Ellesmere Island other scientists have taken measurements of snowfall and glacier loss, allowing a ‘surface mass balance plus discharge’ (SMB+D) model to make an estimate, although lack of ground data for Baffin meant they couldn’t use this in the south.
Satellites measured both islands; ICEsat used a laser radar (LIDAR) to measure ice thickness, whilst GRACE is a pair of satellites nicknamed 'Tom' and 'Jerry' that chase each other across the sky. Tom and Jerry measure tiny changes in the speed of each other caused by the tug of gravity from Earth and directly weigh parts of the Earth below them.
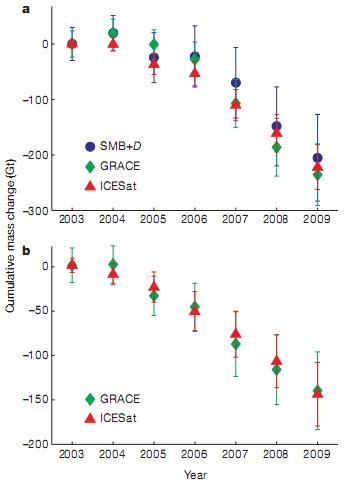
The measurements agree; these Canadian ice caps have lost about 400 billion tons of ice since 2003, an average of 12 of the stupendously big 300 mile long ice walls in Figure 1 melting away every year.

Figure 3 - Total mass change from 2003 of the ice caps of the Canadian Arctic Archipelago for Ellesmere Island (top) and Baffin Island (bottom). Green diamonds are gravity field measurements from GRACE, red triangles are from ICESat LIDAR height measurements and blue circles from near surface measurements combined with a computer model, the Surface Mass Balance plus Discharge method.
The CAA experienced 4 of its 5 warmest summers since 1960 during the study, and the team used the model to calculate that greater loss was from melting rather than changes in snowfall. They found that each degree Celsius meant another 64±14 billion tons of ice melted during the year, and whilst the ice caps added 0.17±0.02 mm/year to sea level rise, the last 3 years averaged 50% higher than that.
A complete melt of all ice outside Greenland & Antarctica would only lead to a 0.5 metre rise in sea level (IPCC, 2001), but this would still be a concern to anyone living in New Orleans, Rotterdam or Maputo.
A slight decline in Alaskan melt rate means that outside Greenland and Antarctica, these two islands are now the biggest regions of land ice melt on the planet.
It's possible that local weather systems will slow down the melt rate in the short-term, but eventually the long-term global warming is expected to dominate northern temperatures, and it seems that we can add these Canadian ice caps to the list of Alaskan glaciers, the Greenland ice sheet and Arctic sea ice where trouble is already brewing in the North.
Posted by MarkR on Monday, 4 July, 2011
 |
The Skeptical Science website by Skeptical Science is licensed under a Creative Commons Attribution 3.0 Unported License. |