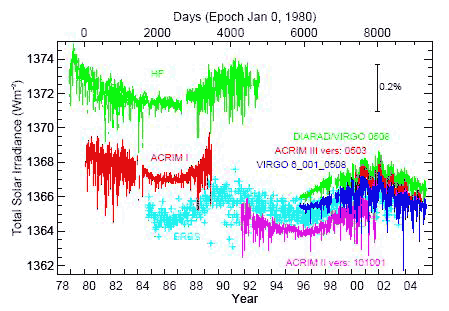
Figure 1: daily averaged values of the TSI from radiometers on different space platforms since November 1978.
In March 2008, we examined the long term solar trend over the last 30 years. There are two major reconstructions of Total Solar Irradiance (TSI) - ACRIM and PMOD. The ACRIM composite shows a slight warming trend. PMOD shows slight cooling. Independent measurements of solar activity are a useful referee to determine which is more accurate. UV levels and solar magnetograms all indicate a slight cooling trend, consistent with PMOD. However, in March 2009, Scafetta 2009 claimed a TSI reconstruction by Krivova & Solanki confirmed the ACRIM composite (h/t to HealthySkeptic for the heads up in June). I contacted Sami Solanki who informed me that their official response was currently awaiting publication. The paper was finally published a few weeks ago.
The paper is ACRIM-gap and total solar irradiance revisited: Is there a secular trend between 1986 and 1996? (Krivova 2009). To briefly summarize the ACRIM/PMOD dispute, solar activity has been measured by satellites since 1979. However, there isn't one single satellite that has continuously measured TSI over the last 30 years. Instead, scientists have had to piece together different measurements from various satellites into a single composite data series. The main disagreement is the handling of data between 1989 and 1991. This is a 2 year gap between the ACRIM I and ACRIM II data series, labelled the "ACRIM Gap".

Figure 1: daily averaged values of the TSI from radiometers on different space platforms since November 1978.
The ACRIM composite by Scafetta and Willson finds that TSI increased over the ACRIM gap. The PMOD composite finds that TSI stayed relatively level. The result is that ACRIM shows a slight warming trend while PMOD shows a slight cooling trend. Is there an independent analysis that can confirm which composite is more accurate? In Scafetta 2009, the authors compare their ACRIM composite to the SATIRE model. This is a model of TSI created by Krivova and Solanki.
There are several versions of the SATIRE model, each developed from different data and optimised for different time scales. For periods after 1974, they calculate TSI values based on daily measurements of solar magnetograms. For longer periods going back centuries, they used sunspot numbers to reconstruct TSI. When parsing sunspot data, averages over several months must be used. Therefore, the sunspot model is significantly less accurate than the magnetogram model on short time scales.
Scafetta 2009 used the sunspot model in their analysis. By design, the sunspot model is suitable for decadal to centennial scales but significantly less accurate on time scales of months. The more appropriate model is based on daily measurements of solar magnetograms. Therefore, Krivova and Solanki take the next logical step and analyse the TSI results from the magnetogram model over the ACRIM gap. What they found was TSI does not increase over this period. Thus the SATIRE model is independent confirmation that the PMOD composite is the more accurate representation of solar activity.
What relevance does this have for the global warming debate? Not terribly much. We're talking about a very slight warming sun versus a very slight cooling sun. Either TSI reconstruction show a stark break down in correlation between sun and climate in the mid 1970's. But the evidence points towards the sun showing a long term cooling trend. Even if solar variations are amplified by cosmic ray modulation and other phenomenon, this means the sun has actually been masking the global warming experienced over the past 30 years.
Note: for a more detailed overview of the ACRIM/PMOD controversy, see "The Sun is getting hotter".
Posted by John Cook on Monday, 2 November, 2009
 |
The Skeptical Science website by Skeptical Science is licensed under a Creative Commons Attribution 3.0 Unported License. |