Like many an aging baby boomer, the Earth is starting to bulge at the waist and is getting thinner on top. In the Earth’s case this isn’t due to a weakness for drinking beer or due to an inherited tendency towards male pattern baldness. Rather, it is because of climate change. As the big ice sheets in Greenland and Antarctica thaw, the melt water is distributed throughout the world’s oceans, causing mass to move away from the poles.
The earth is not exactly round, it’s slightly flattened at the poles and bulging at the Equator. The radius of the Earth measured from its center to sea level at the poles (or where sea level would be at the South Pole if there were no continent there) compared to the radius at the Equator, differs by about 21 km. This means that the point on the Earth’s surface furthest away from its center is not the summit of Everest but rather the top of the volcano Chimborazo in Ecuador. Although the summit of Chimborazo is 2,500 meters less high above sea level than Everest, it is also much closer to the Equator and hence further from the center of the Earth. The reason that the Earth is not quite round is mainly because it spins on its axis through the poles; the centrifugal forces acting on the rocks of the Earth, which are somewhat ductile, tend to push out the parts furthest away from the axis.
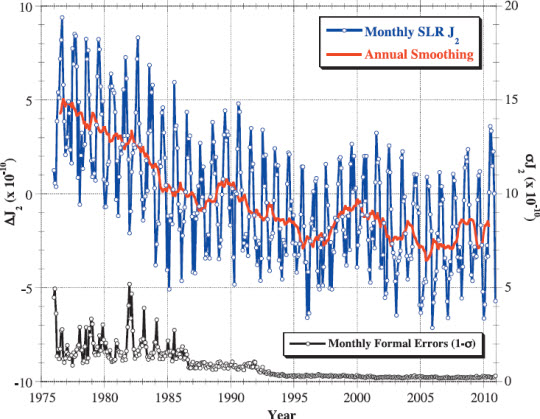
The amount of flattening (or oblateness) of the Earth can be represented by a gravitational parameter known as J2. See here for a definition. This parameter has been measured since the mid-1970’s by satellite laser ranging (SLR) and is found to vary from year to year due, among other things, to the ENSO, the El Niño/La Niña oscillation in the Pacific. See Figure 1 below and here, also.
Figure 1. Measurements of changes in J2 (the Earth’s flatness or oblateness) from satellite laser ranging (SLR, not to be confused with sea-level rise), from Nerem and Wahr (2011). Note the declining trend in J2 from the mid-1970's until the mid 1990's.
From 1976 to 1995 there was also a steady gradual trend downwards, with the Earth’s flatness steadily decreasing due to glacial isostatic adjustment (GIA), which is a long term bouncing back of the Earth’s crust and uppermost mantle, mainly in Canada and NW Europe, due to the melting of the big ice sheets after the last ice age. See Botai and Combink (2009). Something changed in the mid 1990’s.
Figure 2. Rate of ice loss from Greenland. Vertical lines indicate uncertainty, horizontal lines indicate averaging time. Blue circles are from altimetry, red squares are from net accumulation/loss and green triangles are from GRACE. The black line is a straight-line (constant acceleration) fit through the mass balance data for the period 1996–2008 with a slope of 21 gigatonnes/yr2 (Jiang 2010).
What changed was that the ice sheets in Greenland—and probably Antarctica—started melting faster in about 1996. The water from the melted ice disperses quickly around the globe. The global effects from additional isostatic adjustments from this latest melting will take a much longer time to take effect. In a paper by R.S, Nerem and J. Wahr that’s currently in press in Geophysical Research Letters, the results from the SLR observations are combined with data from the GRACE satellites.
GRACE is a system of two satellites that circle the Earth together, one following the other by 220km. When the lead satellite (“Jerry”) approaches an area of relatively higher mass it speeds up a little and it draws slightly ahead of the other satellite (“Tom”). By measuring the small variations in the distance between the two, gravity anomalies can be calculated with great accuracy.
The GRACE data show that the Greenland and Antarctic ice sheets have been losing mass since 2002, when measurements began. Nerem and Wahr calculated what effect this redistribution of mass would have on the Earth’s shape. They also removed the long period trend due to glacial isostatic adjustment (GIA) since the last ice age, using a GIA model from Paulson et al (2006) .
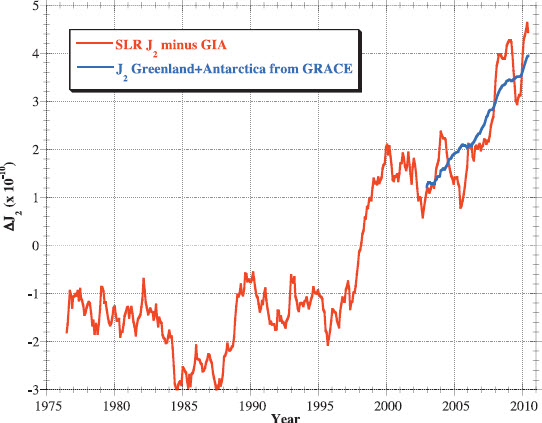
Figure 3. From Nerem and Wahr (2011) showing the residual in the change in J2 (red) measured by SLR, after removing the trend due to GIA; alongside the J2 change expected from the melting of the Greenland and Antarctic ice sheets combined (blue), measured since 2002 by GRACE.
The graph shows how the residual trend in J2 since 2002 is closely accounted for by ice melt from the high latitudes and that it seems reasonable to speculate that the similar trend in J2 since the mid-1990’s was due to the same cause.
Attentive readers of Skeptical Science will have already noted in Figures 1 and 3 that we have a new hockey stick, albeit a junior one with a shaft that goes back only to 1975 and a blade that started around 1995. Nevertheless, it, along with the many others in the team’s locker room (here, here, here and here), shows that recent and sudden changes in the Earth’s climate are being manifested in many different, measurable ways, including, now, the shape of the Earth.
Hat-tip to Friends of Gin and Tonic
Posted by Andy Skuce on Thursday, 14 July, 2011
 |
The Skeptical Science website by Skeptical Science is licensed under a Creative Commons Attribution 3.0 Unported License. |