What The Science Says:
Greenland on the whole is losing ice, as confirmed by multiple satellite and on the ground field measurements.
Climate Myth: Greenland is gaining ice
“[E]ven if it were true that Greenland’s ice had been melting at ‘new record’ rates, after seven and a half years of global cooling global warming cannot be the cause. The true position in Greenland is to be found in Johannessen et al. (2005), where satellite altimetry established that the mean thickness of the entire Greenland ice sheet had increased at 2 inches per year – a total of almost 2 feet – in the 11 years 1993-2003.” (Christopher Monckton)
The interior of Greenland features a huge ice sheet that covers some 80% of that large island. Up to three kilometres thick, the sheet contains a whopping 2.9 million cubic kilometres of ice. If that all melted, global sea level would go up by around seven and a half metres. So it would obviously be good if that didn't happen.
Read any science about ice-sheets and you will soon run into a term that will become familiar: 'mass balance'. Mass balance is an expression of the health of any ice-sheet. Ice-sheets gain mass by snowfall and lose mass by 'ablation', a term covering sublimation, evaporation melt, and meltwater runoff, plus solid ice discharge by the glaciers that drain them. If the value for mass balance of an ice sheet is a positive number, the sheet is growing. But a negative value means the sheet is dwindling.
Since 1991, satellites have obtained continuous data on the Greenland ice-sheet, using radar, lasers and sensitive instruments that can detect changes in local gravity. Such methods allow mass balance to be calculated.
With over 30 years of satellite data now at our disposal, we can step back and look at the big picture. The Greenland ice sheet was close to a neutral state of balance in the 1990s. Since then however, annual losses have risen. One recent paper calculates that Greenland lost almost 4,000 billion tonnes of ice between 1992 and 2018, adding almost eleven millimetres to global sea levels.
Reduction of ice mass balance has occurred for two key reasons. Firstly there is increased meltwater run-off. Have you seen imagery of bright blue pools connected to rivers, flowing across the surface of the ice-sheet, to disappear down into it in spectacular cascades? That's the run-off. Secondly, there is glacier instability - whereby glaciers speed up in their discharge of ice, ultimately to the ocean, with those videos of spectacular calving events many of you will have seen. In Greenland, it's thought that these two processes account for about half of ice-sheet loss each.
Of course, the rate of ice loss varies from year to year. It depends on weather patterns. A cooler year with a lot of snowfall will provide a considerable counter-weight to the loss processes. Then again, in June 2023 the temperature rose to 0.4oC at the Summit Station, a research facility situated 3,216 metres above sea level and near the high-point of the ice-sheet. That has only happened five times in the 34 years since the station was established. Like anywhere else, the year to year pattern is pretty varied: however it's the multidecadal trend that matters and that is very definitely downwards.
It never pays to pick short time-spans when discussing matters of long-term climate trends. Statements like the one by Christopher Monckton in the myth-box above, made in 2009, have simply been made invalid by the march of time.
Please use this form to provide feedback about this new "At a glance" section. Read a more technical version below or dig deeper via the tabs above!
Anecdotes of structures on the Greenland Ice Sheet, such as the now disused Dye 2 and 3 Cold War radar stations being engulfed by snow, have led to claims in some quarters that Greenland is gaining ice. However, a couple of isolated radar stations are not representative of the whole ice-sheet and the late 2000s, when the claims were made, is a long time ago now. So let's take a look at how ice-sheets are evaluated and what has happened since.
On any ice-sheet, ice loss occurs because of surface melt, wind-ablation and sublimation. Surface meltwater finds its way down through crevasse systems to the bed of the glacier, there lubricating and accelerating its down-slope motion. Where ice-shelves around the coastline are lost through melting and/or collapse, the loss of their buttressing effect has the same result, as it also does when warm water causes grounding line retreat. All of these processes are intensified by increased warmth.
Although on-site measurement techniques are used by glaciologists, it has become standard practice to use satellites for large scale monitoring. Satellites return data from extensive areas of remote terrain that would require expeditions to reach. Three key measuring parameters are employed to obtain ice-sheet data. These comprise elevation change, mass change and flux components. The first satellites capable of such measurements were launched in the very early 1990s, ERS-1 in 1991 and ERS-2 in 1995. Thus, the satellite record of ice sheet change is now multidecadal.
The elevation of the Greenland ice-sheet is measured using both laser and radar altimetry. In both cases a signal is fired at the surface of the ice and bounced back. Both radar and laser waves travel at the speed of light, so recording the time they take to return to the satellite means the distance travelled may be calculated. Radar altimeter signals provide good coverage for ice sheets. However, at first there were some resolution issues, causing difficulties in measuring sloped/rough terrain. Laser altimetry is also highly accurate and has an even better resolution than radar altimeters but cloud cover can be an issue.
Radar altimeter signals also penetrate the near-surface uncompacted snow and ice layer. This can introduce a bias into the data. Those who work on such programmes are well aware of such issues. In 2010, Cryosat-2 was placed in orbit, equipped with a much higher resolution radar altimeter. This altimeter uses complex radar combination techniques, known as radar interferometry, to enhance horizontal resolution. That allows more precise measurements of changes in ice elevation of as small as a few centimetres. A further benefit of Cryosat 2 is that it allows for the highest latitude coverage available for an altimeter. Measurements can be taken right up to 88° north. Continuing the theme of better and better equipment, the next generation of monitoring satellites, Sentinel 3a and 3b, were launched in 2016 and 2018 respectively.
Gravimetry measures changes in regional gravitational fields through accurate measurements of the gravitational pull on satellites as they overfly a district. As an ice-sheet gains or loses mass through time, regional gravitational forces are affected. Measuring these effects makes mass change estimates possible. The technique involves precise monitoring of the separation between a pair of satellites in identical orbits. This was one purpose of the space mission that has changed the way we study Earth's gravitational forces. It is called the Gravity Recovery and Climate Experiment, or GRACE, and was launched in 2002. The GRACE mission ended in 2017 but these highly innovative techniques were continued on GRACE-FO (GRACE Follow-On), launched in 2018.
The flux component method involves the estimation of the total mass input and mass output for each individual glacial drainage-system. Put together, these values allow us to estimate the situation for the whole ice sheet. Mass input estimates require detailed knowledge of patterns of snow accumulation, in both space and time. On site observations of glacier mass involve meteorological records, snow pits, ice cores and marker poles. These are used to ground truth regional ice-sheet models. Good agreement between modelling and measurements give confidence in the usefulness of the method.
Outflow estimates involve recording the speed of the ice flow and the thickness of the ice. Radar Interferometry allows for direct all-weather recording of surface velocities. Depth of ice streams has been estimated using various means, from bedrock topography models to ground penetrating radar surveys.
Satellite-based observations have been used to record ice surface velocity, although the velocity of an ice sheet often varies with depth, introducing some uncertainty. Outlet glaciers, though, tend to move by rapid basal sliding. Such ice-streams therefore have minimal variation in speed with depth.
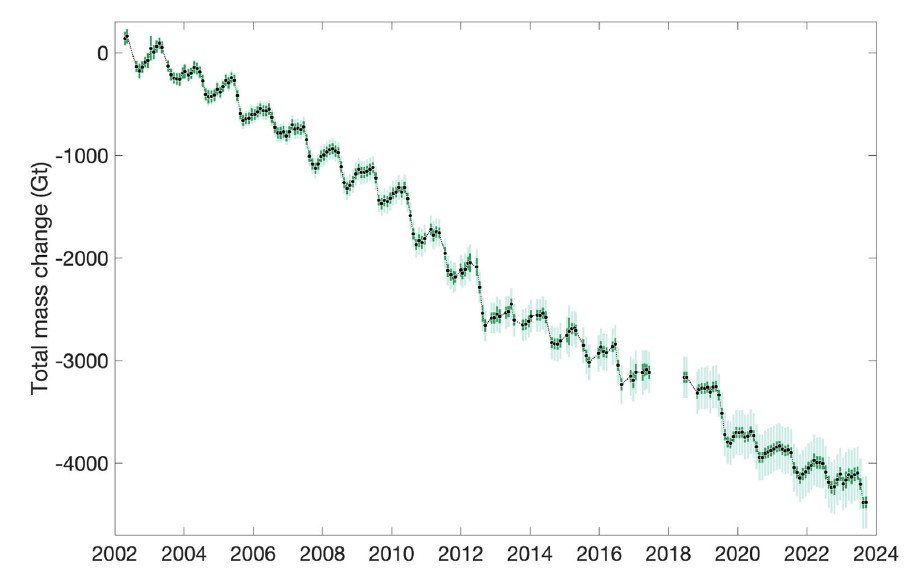
Fig. 1: GRACE and GRACE-FO satellite gravimetry-based mass balance, representing the total mass change in the Greenland Ice-sheet in gigatons (Gt) from April 2002 to September 2023. Source: NOAA Arctic Report Card 2023, page 33.
The results of these various missions all point at one thing (e.g. Fig. 1). Net negative mass balance - ice loss has dominated every year since 1998. It's highly variable, though as the weather fluctuates. Some winters see much greater snow accumulation than others. Some summers are warmer than others. Just as an example, in the one year period from 1 September 2022 too 31 August 2023, GRACE-FO measured a total GIS mass balance of -156 +/- 22 Gt. That equates to 0.4 mm of sea level rise in 12 months. However, the year was a below-average one for ice-melt. Yet by the 2010-2018 period, average annual ice-loss was six times that of the 1990s (Mouginot et al. 2019).
An extensive literature exists on the methodology of and results from ice-sheet monitoring on Greenland from the early days (e.g. Johannessen et al. 2005) to the present (e.g. Shepherd et al. 2019; Mankoff et al. 2021 and references therein). However, NOAA's annual Arctic Report Card is a good place to start exploring, with much more extensive literature citations than is possible here.
 |
The Skeptical Science website by Skeptical Science is licensed under a Creative Commons Attribution 3.0 Unported License. |