What The Science Says:
An enhanced greenhouse effect from CO2 has been confirmed by multiple lines of empirical evidence. Satellite measurements of infrared spectra over the past 40 years observe less energy escaping to space at the wavelengths associated with CO2. Surface measurements find more downward infrared radiation warming the planet's surface. This provides a direct, empirical causal link between CO2 and global warming.
Climate Myth: Increasing CO2 has little to no effect
"While major green house gas H2O substantially warms the Earth, minor green house gases such as CO2 have little effect.... The 6-fold increase in hydrocarbon use since 1940 has had no noticeable effect on atmospheric temperature ... " (Environmental Effects of Increased Atmospheric Carbon Dioxide)
The greenhouse gas qualities of carbon dioxide have been known for over a century. In 1861, John Tyndal published laboratory results identifying carbon dioxide as a greenhouse gas that absorbed heat rays (longwave radiation). Since then, the absorptive qualities of carbon dioxide have been more precisely quantified by decades of laboratory measurements (Herzberg & Herzberg 1953, Burch et al. 1962, Burch et al. 1970, etc).
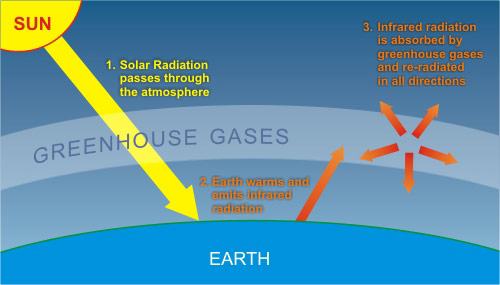
The greenhouse effect occurs because greenhouse gases let sunlight (shortwave radiation) pass through the atmosphere. The earth absorbs sunlight, warms then reradiates heat (infrared or longwave radiation). The outgoing longwave radiation is absorbed by greenhouse gases in the atmosphere. This heats the atmosphere which in turn re-radiates longwave radiation in all directions. Some of it makes its way back to the surface of the earth. So with more carbon dioxide in the atmosphere, we expect to see less longwave radiation escaping to space at the wavelengths that carbon dioxide absorb. We also expect to see more infrared radiation returning back to Earth at these same wavelengths.
In 1970, NASA launched the IRIS satellite that measured infrared spectra between 400 cm-1 to 1600 cm-1. In 1996, the Japanese Space Agency launched the IMG satellite which recorded similar observations. Both sets of data were compared to discern any changes in outgoing radiation over the 26 year period (Harries et al. 2001). The resultant change in outgoing radiation was as follows:
Figure 1: Change in spectrum from 1970 to 1996 due to trace gases. 'Brightness temperature' indicates equivalent blackbody temperature (Harries et al. 2001).
What they found was a drop in outgoing radiation at the wavelength bands that greenhouse gases such as carbon dioxide (CO2) and methane (CH4) absorb energy. The change in outgoing radiation is consistent with theoretical expectations. Thus the paper found "direct experimental evidence for a significant increase in the Earth's greenhouse effect".
This result has been confirmed by subsequent papers using more recent satellite data. The 1970 and 1997 spectra were compared with additional satellite data from the NASA AIRS satellite launched in 2003 (Griggs & Harries 2004). This analysis was extended to 2006 using data from the AURA satellite launched in 2004 (Chen et al. 2007). Both papers found the observed differences in CO2 bands matching the expected changes from rising carbon dioxide levels. Thus we have empirical evidence that increased CO2 is causing an enhanced greenhouse effect.
A compilation of surface measurements of downward longwave radiation from 1973 to 2008 find an increasing trend of more longwave radiation returning to earth, attributed to increases in air temperature, humidity and atmospheric carbon dioxide (Wang & Liang 2009). More regional studies such as an examination of downward longwave radiation over the central Alps find that downward longwave radiation is increasing due to an enhanced greenhouse effect (Philipona et al. 2004).
Taking this a step further, an analysis of high resolution spectral data allows scientists to quantitatively attribute the increase in downward radiation to each of several greenhouse gases (Evans 2006). The results lead the authors to conclude that "this experimental data should effectively end the argument by skeptics that no experimental evidence exists for the connection between greenhouse gas increases in the atmosphere and global warming."
Figure 2: Spectrum of the greenhouse radiation measured at the surface. Greenhouse effect from water vapor is filtered out, showing the contributions of other greenhouse gases (Evans 2006).
Huber and Knutti (2011) published a paper in Nature Geoscience, Anthropogenic and natural warming inferred from changes in Earth’s energy balance. They take an approach in this study which utilizes the principle of conservation of energy for the global energy budget using the measurements discussed above, and summarize their methodology:
"We use a massive ensemble of the Bern2.5D climate model of intermediate complexity, driven by bottom-up estimates of historic radiative forcing F, and constrained by a set of observations of the surface warming T since 1850 and heat uptake Q since the 1950s....Between 1850 and 2010, the climate system accumulated a total net forcing energy of 140 x 1022 J with a 5-95% uncertainty range of 95-197 x 1022 J, corresponding to an average net radiative forcing of roughly 0.54 (0.36-0.76)Wm-2."
Essentially, Huber and Knutti take the estimated global heat content increase since 1850, calculate how much of the increase is due to various estimated radiative forcings, and partition the increase between increasing ocean heat content and outgoing longwave radiation. The authors note that more than 85% of the global heat uptake (Q) has gone into the oceans, including increasing the heat content of the deeper oceans, although their model only accounts for the upper 700 meters.
Figure 3 is a similar graphic to that presented in Meehl et al. (2004), comparing the average global surface warming simulated by the model using natural forcings only (blue), anthropogenic forcings only (red), and the combination of the two (gray).
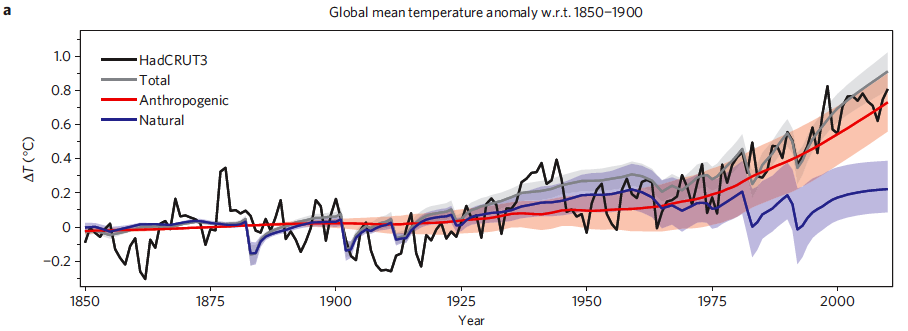
Figure 3: Time series of anthropogenic and natural forcings contributions to total simulated and observed global temperature change. The coloured shadings denote the 5-95% uncertainty range.
In Figure 4, Huber and Knutti break down the anthropogenic and natural forcings into their individual components to quantify the amount of warming caused by each since the 1850s (Figure 4b), 1950s (4c), and projected from 2000 to 2050 using the IPCC SRES A2 emissions scenario as business-as-usual (4d).

Figure 4: Contributions of individual forcing agents to the total decadal temperature change for three time periods. Error bars denote the 5–95% uncertainty range. The grey shading shows the estimated 5–95% range for internal variability based on the CMIP3 climate models. Observations are shown as dashed lines.
As expected, Huber and Knutti find that greenhouse gases contributed to substantial warming since 1850, and aerosols had a significant cooling effect:
"Greenhouse gases contributed 1.31°C (0.85-1.76°C) to the increase, that is 159% (106-212%) of the total warming. The cooling effect of the direct and indirect aerosol forcing is about -0.85°C (-1.48 to -0.30°C). The warming induced by tropospheric ozone and solar variability are of similar size (roughly 0.2°C). The contributions of stratospheric water vapour and ozone, volcanic eruptions, and organic and black carbon are small."
Since 1950, the authors find that greenhouse gases contributed 166% (120-215%) of the observed surface warming (0.85°C of 0.51°C estimated surface warming). The percentage is greater than 100% because aerosols offset approximately 44% (0.45°C) of that warming.
"It is thus extremely likely (>95% probability) that the greenhouse gas induced warming since the mid-twentieth century was larger than the observed rise in global average temperatures, and extremely likely that anthropogenic forcings were by far the dominant cause of warming. The natural forcing contribution since 1950 is near zero."
There are multiple lines of empirical evidence that increasing carbon dioxide causes an enhanced greenhouse effect. Laboratory tests show carbon dioxide absorbs longwave radiation. Satellite measurements confirm less longwave radiation is escaping to space at carbon dioxide absorptive wavelengths. Surface measurements find more longwave radiation returning back to Earth at these same wavelengths. The result of this energy imbalance is the accumulation of heat over the last 40 years.
Intermediate rebuttal written by dana1981
 |
The Skeptical Science website by Skeptical Science is licensed under a Creative Commons Attribution 3.0 Unported License. |